.png)
Understanding PETE dashbaord
Overview
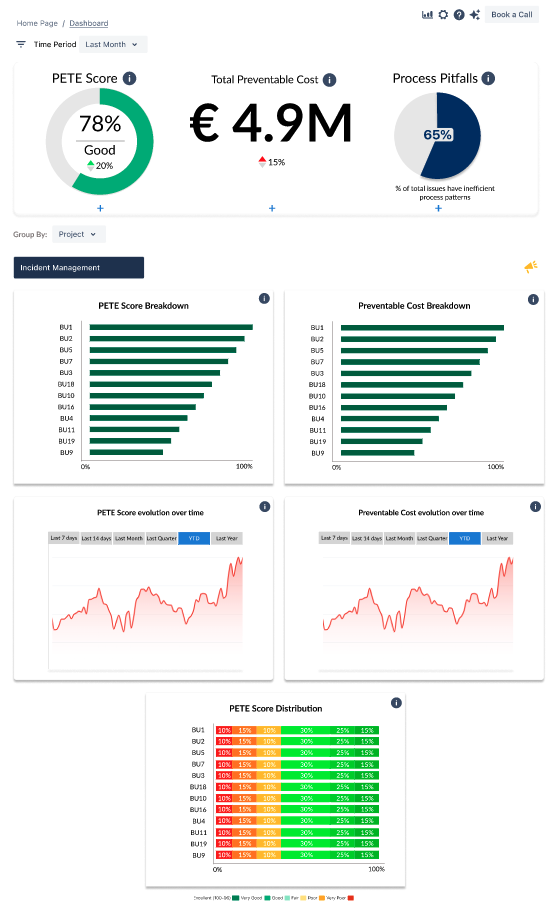
PETE’s Executive Dashboard is your go-to starting point and probably the first stop for the CIO or IT Service Manager, coffee in hand, to start the day. It offers a quick snapshot of everything happening within your IT support organization.
The visual below showcases v1.0 of PETE’s Executive Dashboard. Future releases will bring even more detailed insights across all ITSM processes.
Breakdown of PETE’s Executive Dashboard
| 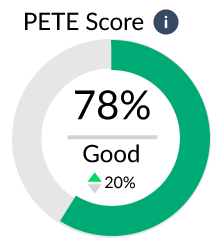 | The PETE Score is your new compass for IT support efficiency, quality, and speed. Think of it as your IT support team's credit score. A green upward trend arrow indicates that the score has improved compared to the previous period selected in the Global Filter. The red arrow indicates that the score has decreased compared to the previous period selected in the Global Filter. Drill down into various dimensions for a deeper understanding of your organization’s IT support performance. |
| 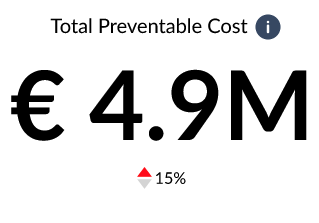 | Curious about the value of hidden efficiencies? PETE uncovers inefficiencies in your IT processes and reveals their cash value. A green upward trend arrow indicates that the score has improved compared to the previous period selected in the Global Filter. The red arrow indicates that the score has decreased compared to the previous period selected in the Global Filter. With actionable recommendations from years of ITSM consulting experience, you’ll have a clear path to reducing inefficiencies and boosting your organization’s performance. |
| 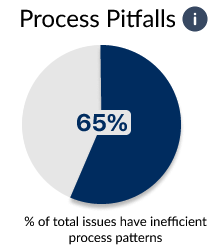 | PETE uncovers inefficiencies in your IT processes, breaking them down into common patterns seen in IT organizations worldwide. Explore actionable insights on the patterns PETE has identified in your organization. |
| 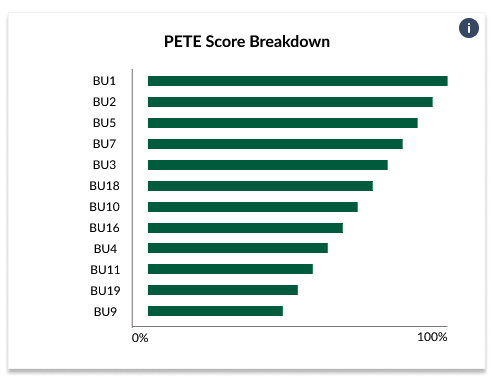 | PETE Score Breakdown based on the selected ‘Group By’ dimension. Default grouping will be based on the Projects which has been selected. You can change the ‘Group By’ configuration in the ‘Group By’ downdown. |
| 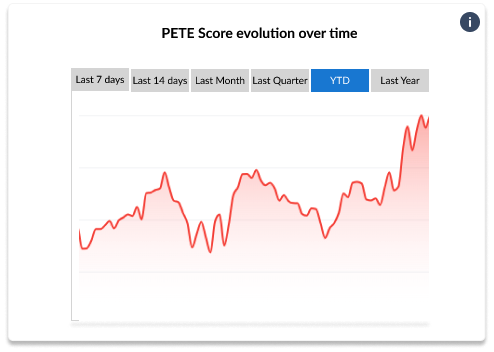 | Track how your team’s PETE Score has evolved over time. |
| 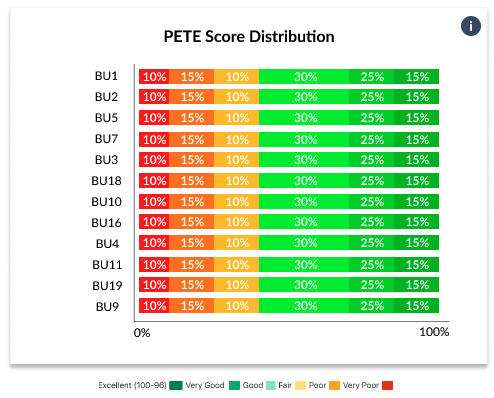 | Get a quick breakdown of how process scores are distributed across the ‘Group By’ dimension. Default grouping will be based on the Projects which has been selected. You can change the ‘Group By’ configuration in the ‘Group By’ downdown. |
|  | PETE Score Breakdown based on the selected ‘Group By’ dimension. Default grouping will be based on the Projects which has been selected. You can change the ‘Group By’ configuration in the ‘Group By’ downdown. |
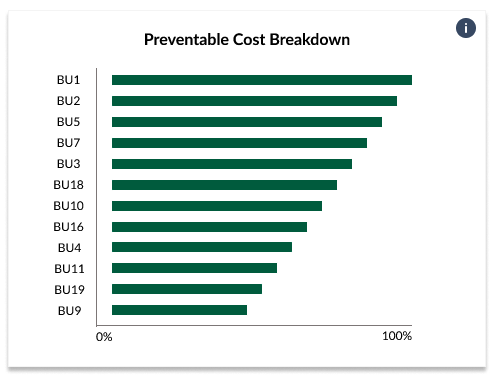
| 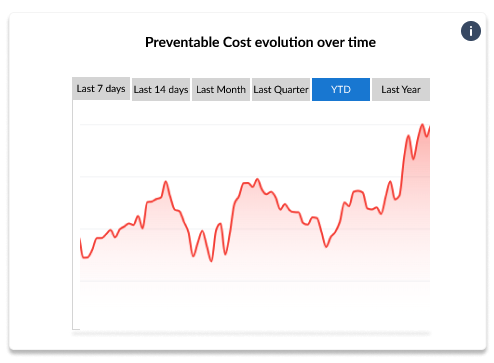 | See how your team’s preventable cost efficiencies have improved over time. |