
SLAs provide the scaffolding for efficient IT service management. They define the expectations between service teams and customers as to how quickly issues will be handled and solved. Looking closely at SLAs isn't just busy work; rather, it is important for maintaining trust and providing good customer service. This article discusses how JSM accommodates out-of-the-box SLA tracking for teams, areas where those first reports lose their luster, and how to circumvent those issues using advanced reporting with Charts & Reports for Jira Service Management by view26.
Importance of SLAs in JSM
SLAs in any IT service desk identify the promised response and resolution times for different request types (for example, response within 1 hour for high-priority incidents). Consistent adherence to such targets is crucial for customer satisfaction and confidence. Breach of SLAs signifies an idea of quality failure in the service, when, on the contrary, the honoring becomes the sign of reliable support from the customer view. SLAs manage expectations for the customer operations and direct the IT support teams in proper task prioritization.
Jira Service Management realizes how important SLAs are and boasts a very reliable self-contained SLA tracking capacity. Teams are able to specify SLAs such as "Time to First Response" or "Time to Resolution," with specific goals for different priorities or customer types. Once configured, every issue displays its SLA timers to agents, counting down to the target. The real-time view into SLA of each ticket helps agents gauge priority on what must be delivered first and alerts them not to miss any major deadlines. To sum up, the native SLA features in JSM make sure that service commitments between support teams and customers are communicated and monitored at all times.
Where Standard Jira SLA Reports Fall Short
While JSM includes SLA tracking and basic reporting, many teams quickly discover a few limitations when trying to report on SLAs at a higher level.
⚠️ Project-Specific Reporting – JSM reports are limited to individual projects. Many organizations structure their JSM environment with separate projects for different customers, teams, or regions. When managing multiple service projects, or, actually, if you're looking to analyze SLAs across different teams or customer groups, the native tools may feel limiting. There exists no straightforward way to create one report connected across multiple projects or aggregate SLA data across your entire organization. There have been multiple questions on the community asking if it is possible get a unified SLA report “calculating the KPIs across multiple projects” but it is something JSM doesn’t support natively.
📊 Limited Customization & Context – While Jira reports show basic SLA metrics, they don’t allow users to analyze breaches by request type, priority, or agent performance. JSM’s built-in reports offer preset charts (e.g. an SLA success rate over the past week) but don’t easily allow custom filters or comparisons (such as SLA performance for one customer organization vs. another or Team A vs. Team B). You can create multiple separate reports or use filters one by one, but you cannot easily apply a dynamic filter across all your SLA charts at once. In fact, even the Jira dashboard gadgets for SLAs are tied to specific projects or predefined reports
The bottom line: JSM’s native SLA reporting is powerful for a single team or project, but it struggles when you need a consolidated or granular view across multiple projects, teams, or customer organizations. You would often have to manually aggregate data and use spreadsheets to work around these limitations. This is where a marketplace app can greatly enhance your visibility.
Enhance SLA Reporting with view26 Charts & Reports
With Charts & Reports, you can:
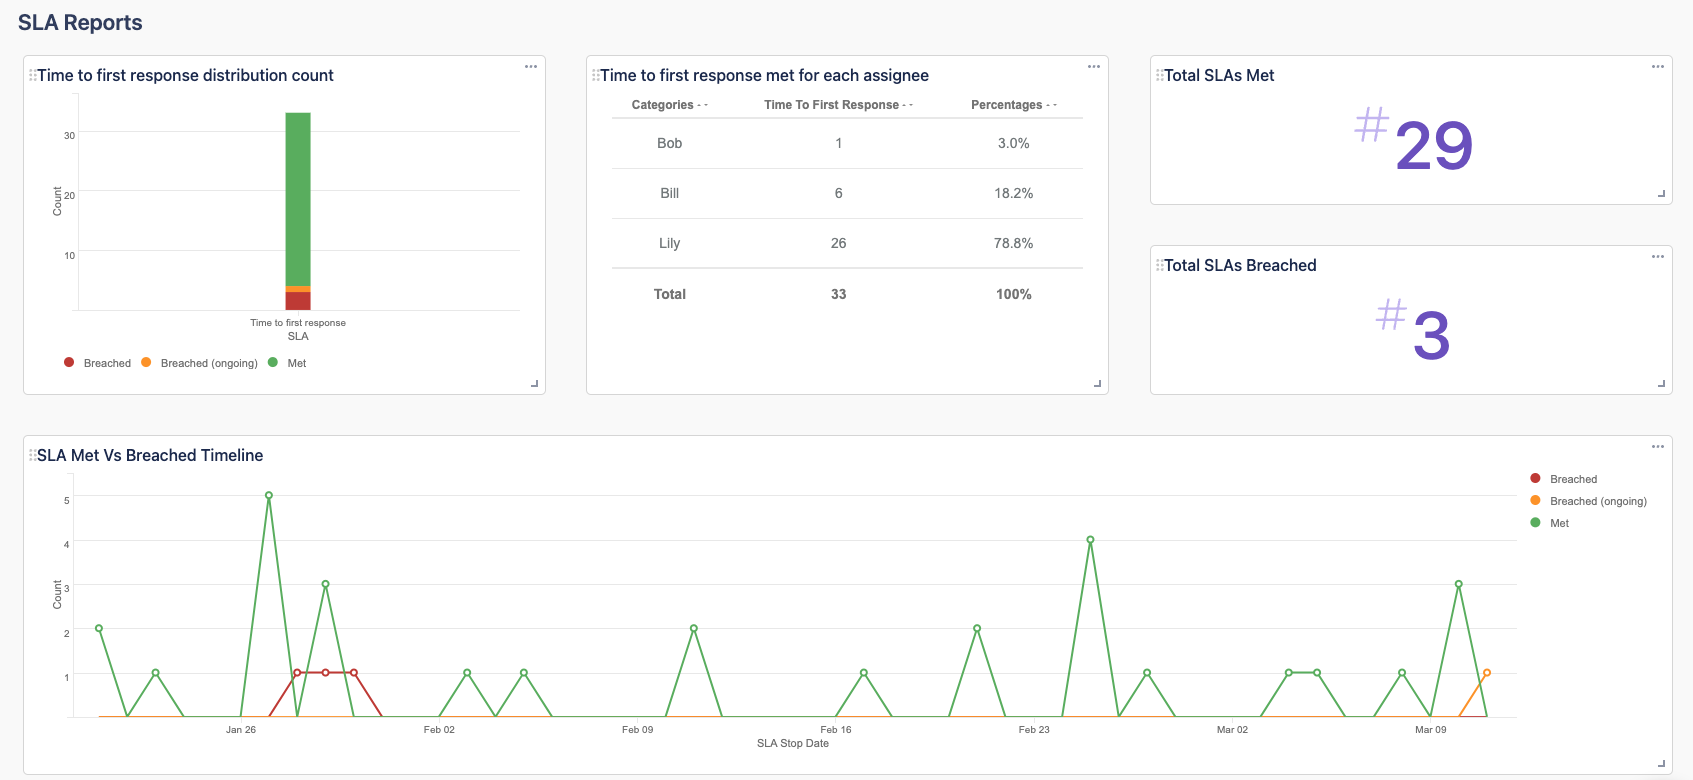
📊 Compare SLA Metrics Across Projects – Unlike JSM’s standard reports, Charts & Reports allows you to aggregate and compare SLA performance across multiple projects. It lets you design entire dashboards containing several SLA charts side by side. You can have a line chart for “SLA success trend this month,” a bar chart for “Tickets breached vs met by priority,” and a pie chart for “Breached issues by issue type” all on the same screen. This comprehensive overview means you no longer need to jump between projects or dashboards – one page can display all your critical SLA metrics at once.
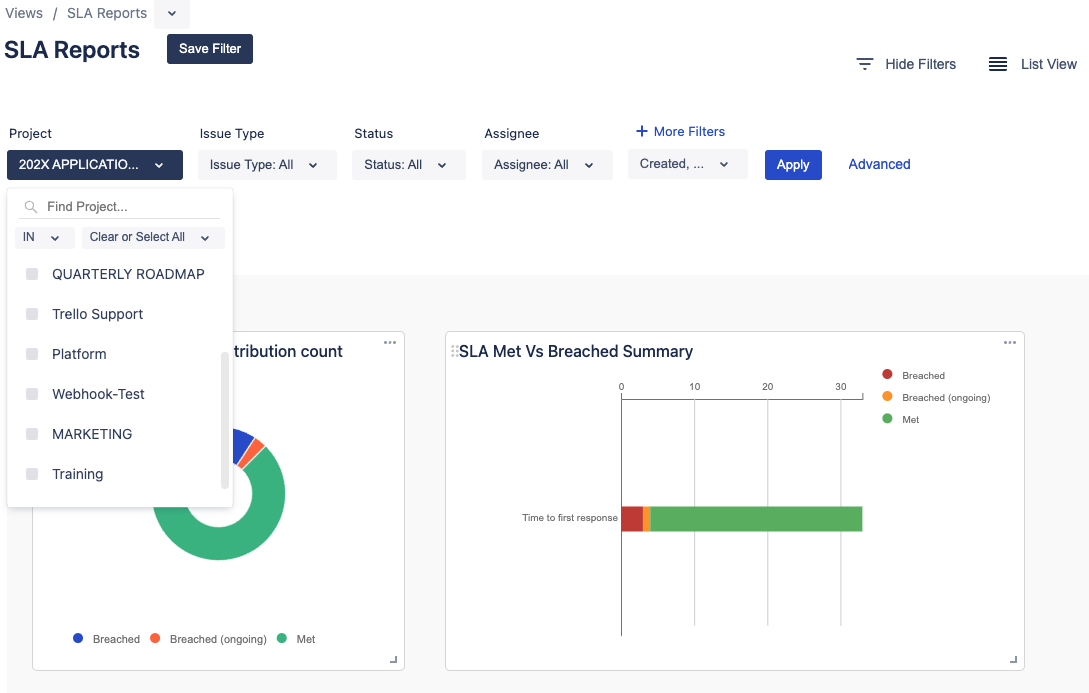
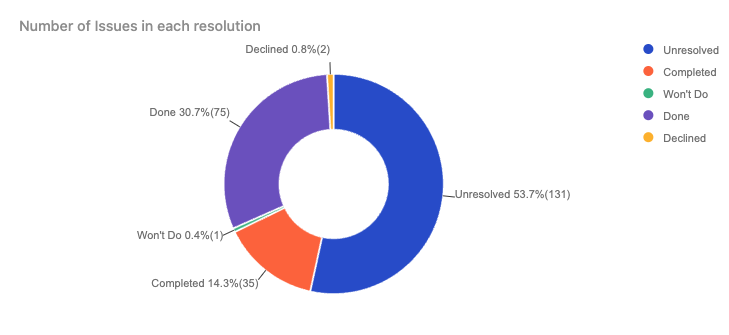
📉 Analyze SLA Breaches with Context – Bar and pie charts help you break down SLA breaches by category, making it easier to identify which request types, teams, or priorities are causing delays. Charts & Reports' dashboards also come with a powerful filtering capability that applies globally to all charts on the view. You can filter by fields like project, organization (customer), request type, priority, and more – and the filter instantly refreshes all the charts on the dashboard to reflect that selection.

🚀 Advanced Data Aggregation, customizable Summary Charts,KPI Tracking and Better Sharing and Visibility – Instead of exporting SLA reports to spreadsheets, Charts & Reports gives you real-time insights within an intuitive dashboard where you can add widgets and custom summary views in addition to your charts.KPI widgets are great for highlighting key numbers at a glance – such as “97% SLA Success Rate this quarter” or “5 SLA Breaches this week”. With VIEW26, you can configure these KPI metrics based on JQL or filters, and display them prominently as big-number tiles or gauges. Sharing SLA reports have also never been easier-You can generate a public link to a dashboard or even publish it to your JSM customer portal for external clients to view. This means you could create an SLA report view for each major client and share it with them, providing transparency about how you’re performing against their SLAs. Instead of sending spreadsheets or screenshots each month, customers can self-serve and check the live dashboard (with only their data visible).
Beyond SLA Reporting: A Holistic View of Your Service Management Data
While SLA tracking is an essential piece, View26 Charts & Reports goes far beyond just SLA analytics. Our solution enables Jira Service Management users to analyze agent performance, customer satisfaction trends, request resolution times, and more—helping organizations make data-driven decisions that improve service quality at every level.
What insights are you missing from your JSM reports? Share your experiences in the comments below!
🚀 Ready to elevate your JSM reporting? Try Charts and Reports for Jira Service Management today and turn your data into actionable insights!