VIEW26 Charts & Reports allows you share reports with external customers via the JIRA ServiceDesk Customer Portal (https://<XYZ>.atlassian.net/servicedesk/customer/portals where XYZ is your domain) - providing self-serviced, real-time transparency.
A Charts & Reports option will become available in the Jira Customer Portal when you have installed the VIEW26 Charts & Reports Jira ServiceDesk App.
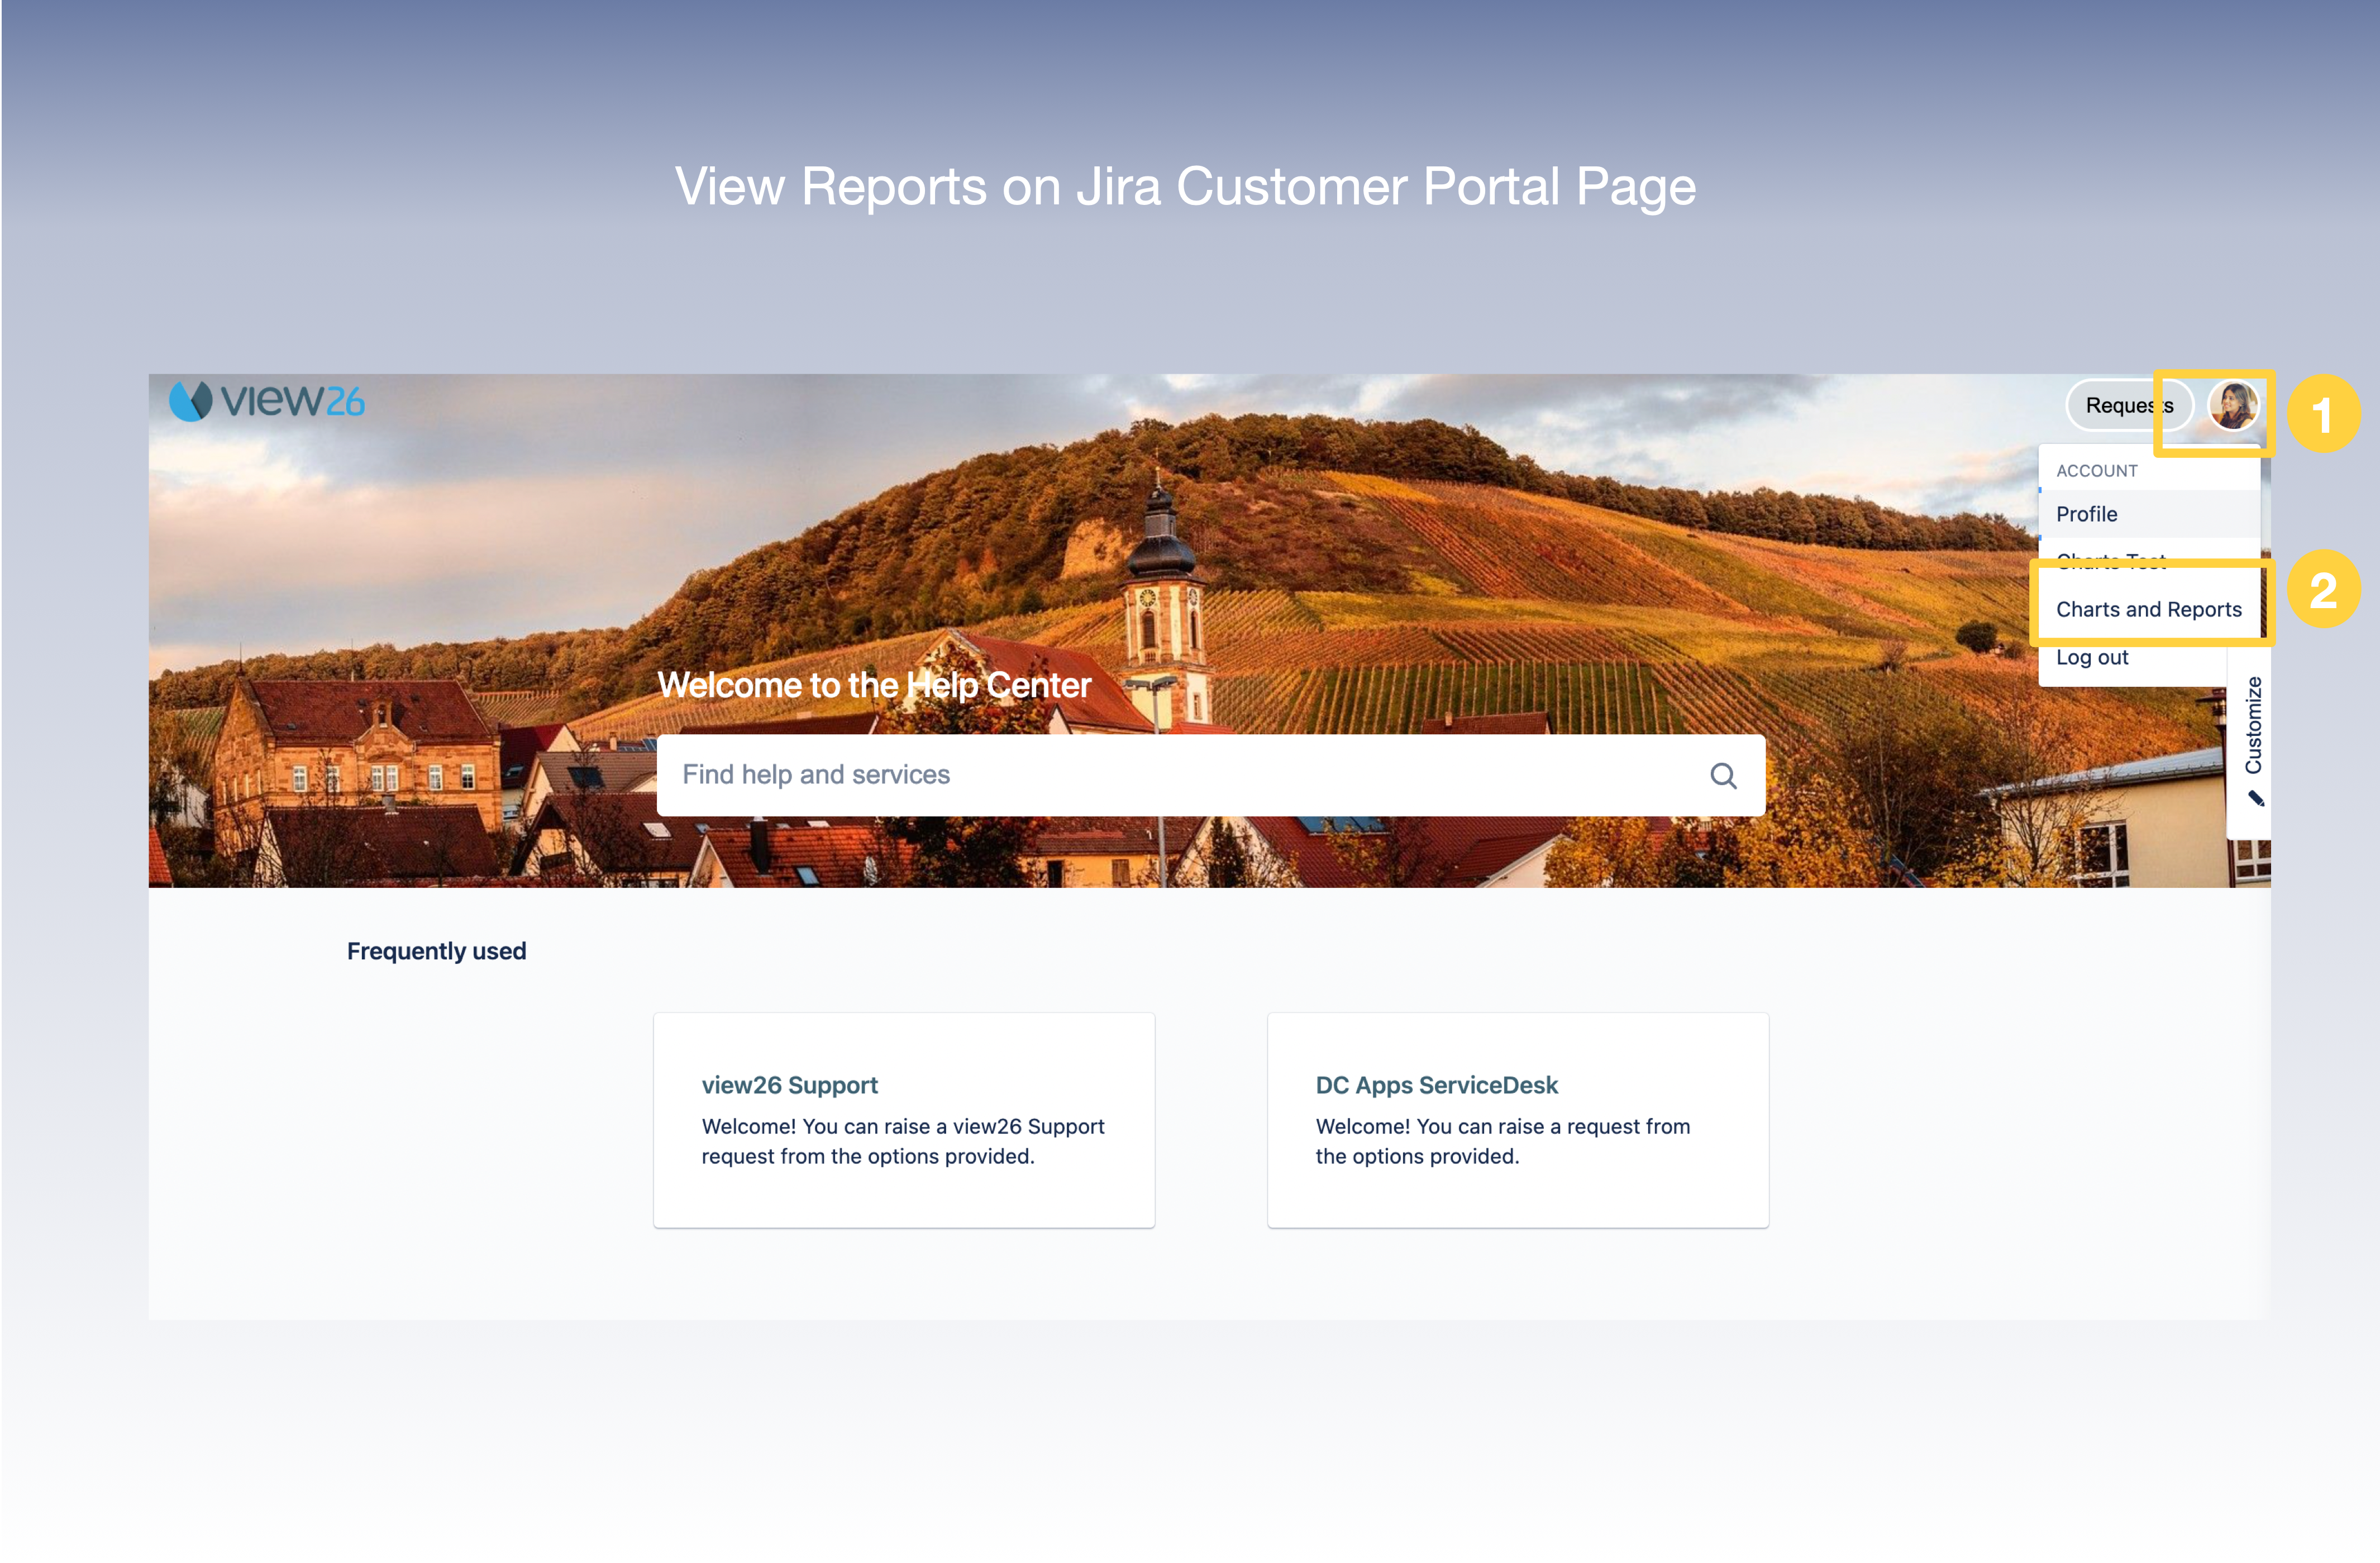
1. Click on the User Profile
2. Click on Charts and Reports
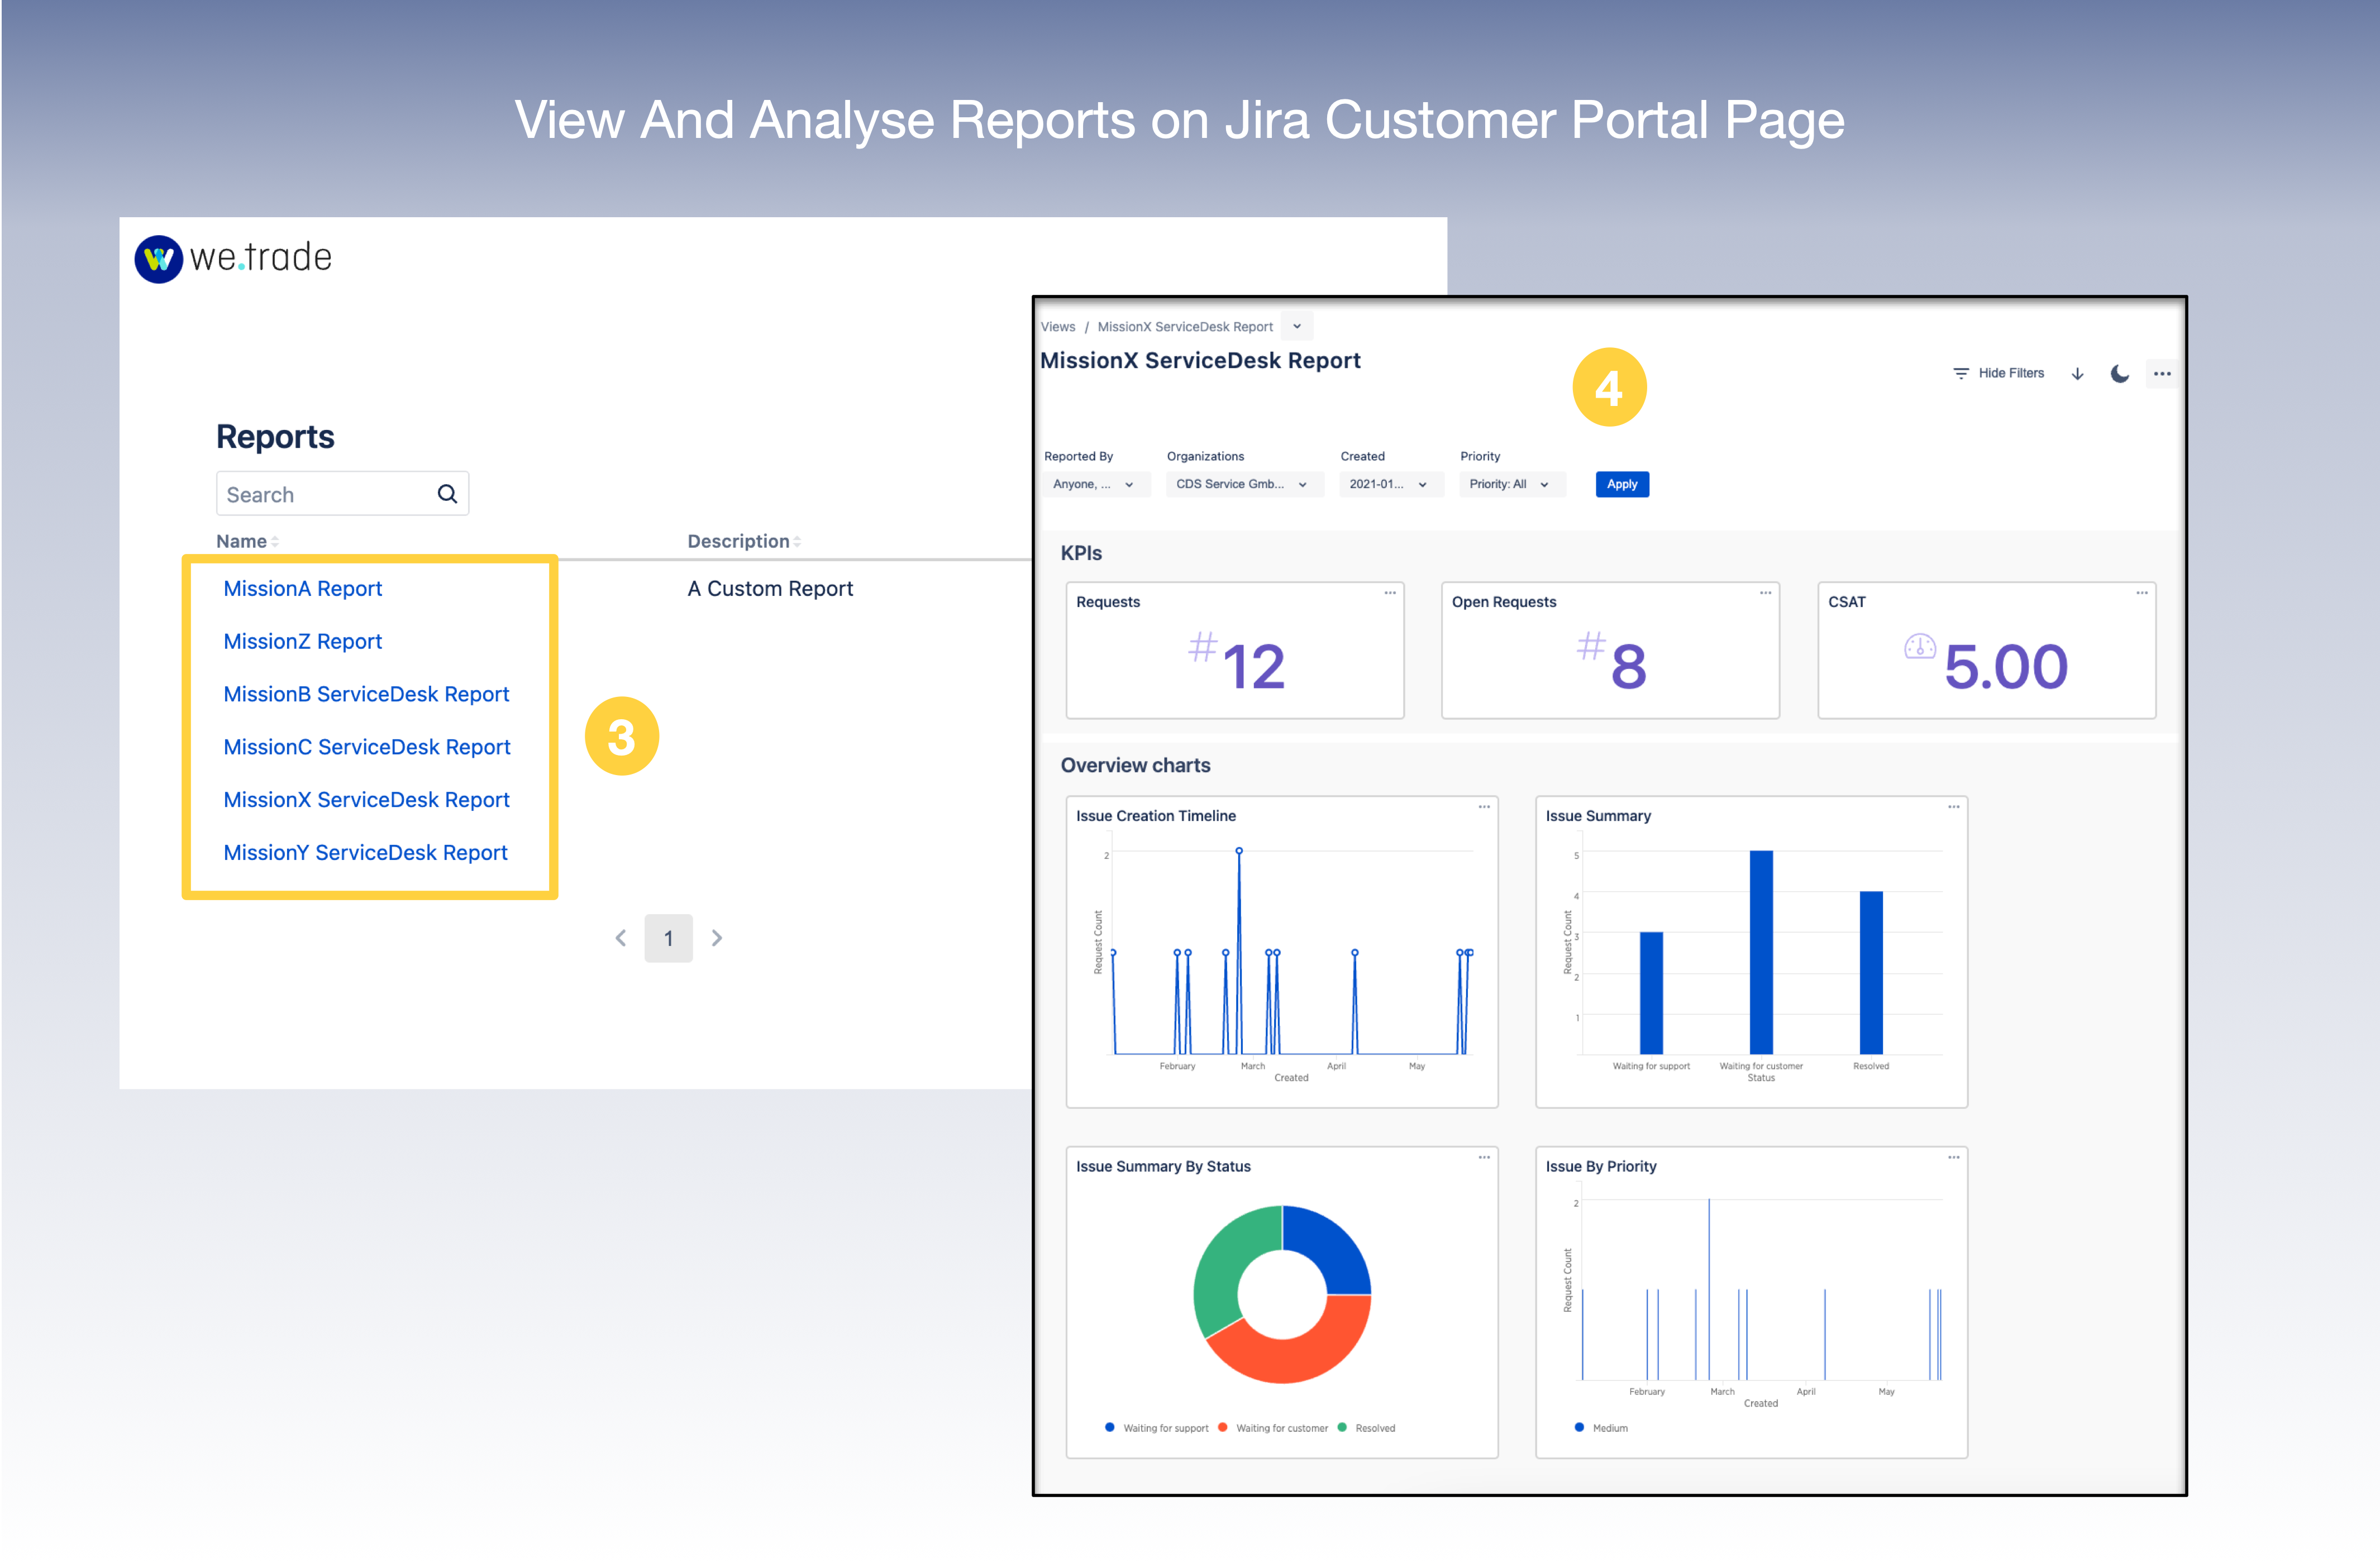
3. This will open the List of all the Views which are shared with the Customer’s Organization
4. Click on any of the Views to Open up the Report
5. You can analyse and explore the Report further using all the different filters available
Jira Users accessing the customer portal can access all Requests irrespective of which organization(s) they may be part of.
Use additional customer portal filters
Your Jira administrator can enable additional fields, such as Priority or Created, in Settings → Customization → Customer Portal → Portal Filters. Use the available filters in the shared report to narrow the results.
If you only see the organization or reporter filters, ask your Jira administrator to configure Portal Filters. Fields added through More Filters in the agent View do not automatically appear in the customer portal.