Skip table of contents

Understanding the Dashboard

Overview

Navigator Executive Dashboard
The Dashboard in ITSM Navigator serves as the starting point for CIOs and IT Service Managers to begin their day. It offers a snapshot of your IT support organization’s performance at a glance.

image-20250929-075213.png

Breakdown of Dashboard Sections

  1. ITSM Capability Level

image-20250929-075640.png

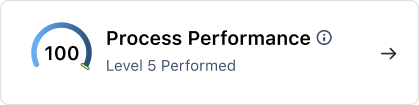
ITSM Capability Level represents your organization's ITSM excellence on a 0-5 scale.

  • Level 0 (Incomplete): 0-16% - No consistent process.

  • Level 1 (Performed): 16-33% - Basic processes exist but are reactive.

  • Level 2 (Managed): 35-50% - Processes are planned and tracked.

  • Level 3 (Established): 50-66% - Processes are standardized and documented.

  • Level 4 (Predictable): 66-83% - Processes are measured and controlled.

  • Level 5 (Optimizing): 84-100% - Continuous improvement is embedded.

How it's calculated
The overall Capability Level is the minimum of your Process Maturity Level and Process Performance Level.
This ensures that both design and execution of ITSM practices advance together.

  1. Process Maturity Assessment

image-20250929-075842.png

Indicates how well ITSM processes are defined, documented,
and aligned with standards.

  • Based on FitSM and ISO 20000 best-practice
    assessments

  • Each process (e.g., Incident, Change, Problem
    Management) is broken down across dimensions like
    planning, execution, roles and controls.

  1. Process Pitfalls

image-20250929-075901.png

Shows how ITSM processes are executed in practice, using
live operational data

  • Driven by real-time process mining

  • Reveals activity compliance and bottlenecks across
    processes.

  1. Process Maturity Assessment

image-20250929-080043.png

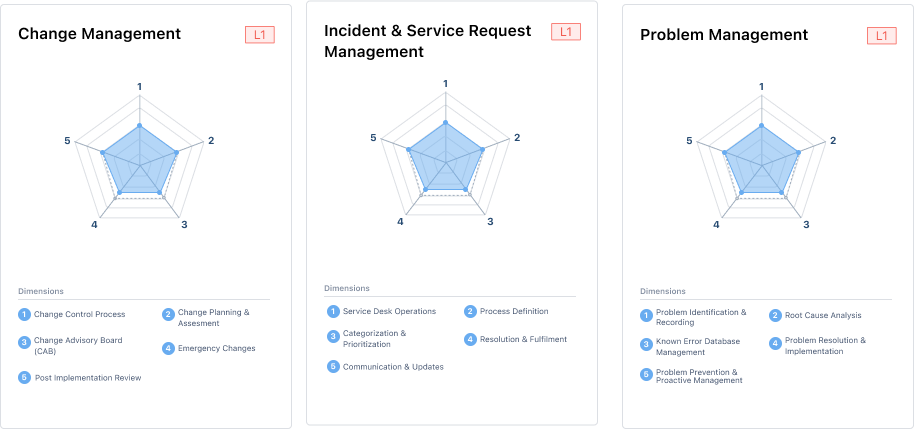
The Process Maturity Assessment provides a structured evaluation of how well your ITSM processes are defined, standardized, and aligned with best practices.

  • Based on FitSM and ISO 20000 frameworks.

  • Each ITSM process (e.g., Incident & Service Request Management, Change Management, Problem Management) is assessed against its five maturity dimensions.

  • Results are shown using radar charts, making it easy to identify strengths, weaknesses, and improvement areas.

  • The maturity level for each process is determined by the lowest-scoring dimension.

👉 Click View Full Assessment for a detailed breakdown of all processes and dimensions.

  1. Process Performance Analytics

image-20250929-080100.png

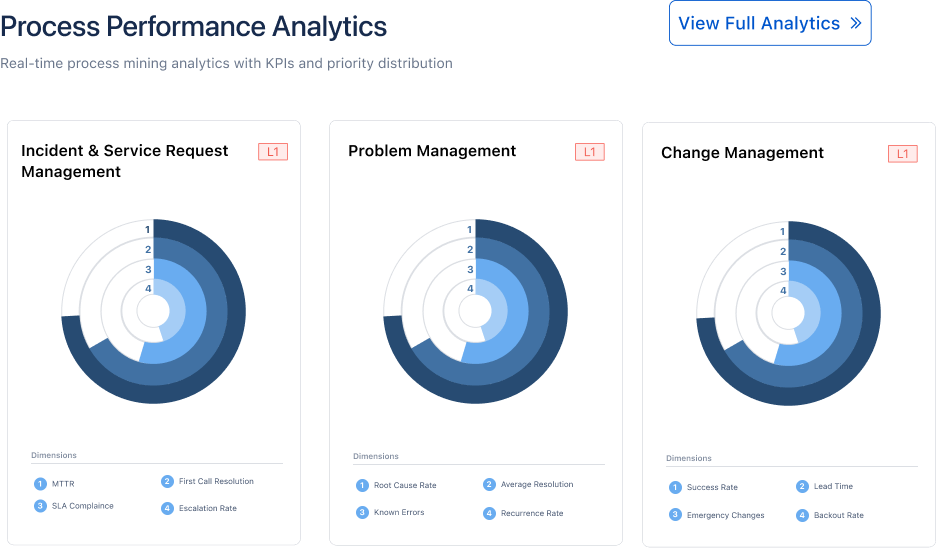
The Process Performance Analytics section measures how effectively your ITSM processes are executed in real-time, based on operational data.

  • Powered by process mining analytics, offering data-driven insights into execution quality.

  • Each ITSM process is evaluated across the four weighted performance dimensions:

    • Conformance Rate (30%)

    • Throughput Efficiency (25%)

    • Cycle Time Performance (25%)

    • Rework / Quality Rate (20%)

  • Visualized using circular performance charts, highlighting KPI achievements and priority distribution.

  • Helps identify bottlenecks, SLA risks, and rework patterns in day-to-day operations.

👉 Click View Full Analytics for detailed KPI reports and drill-downs per process.

JavaScript errors detected

Please note, these errors can depend on your browser setup.

If this problem persists, please contact our support.