
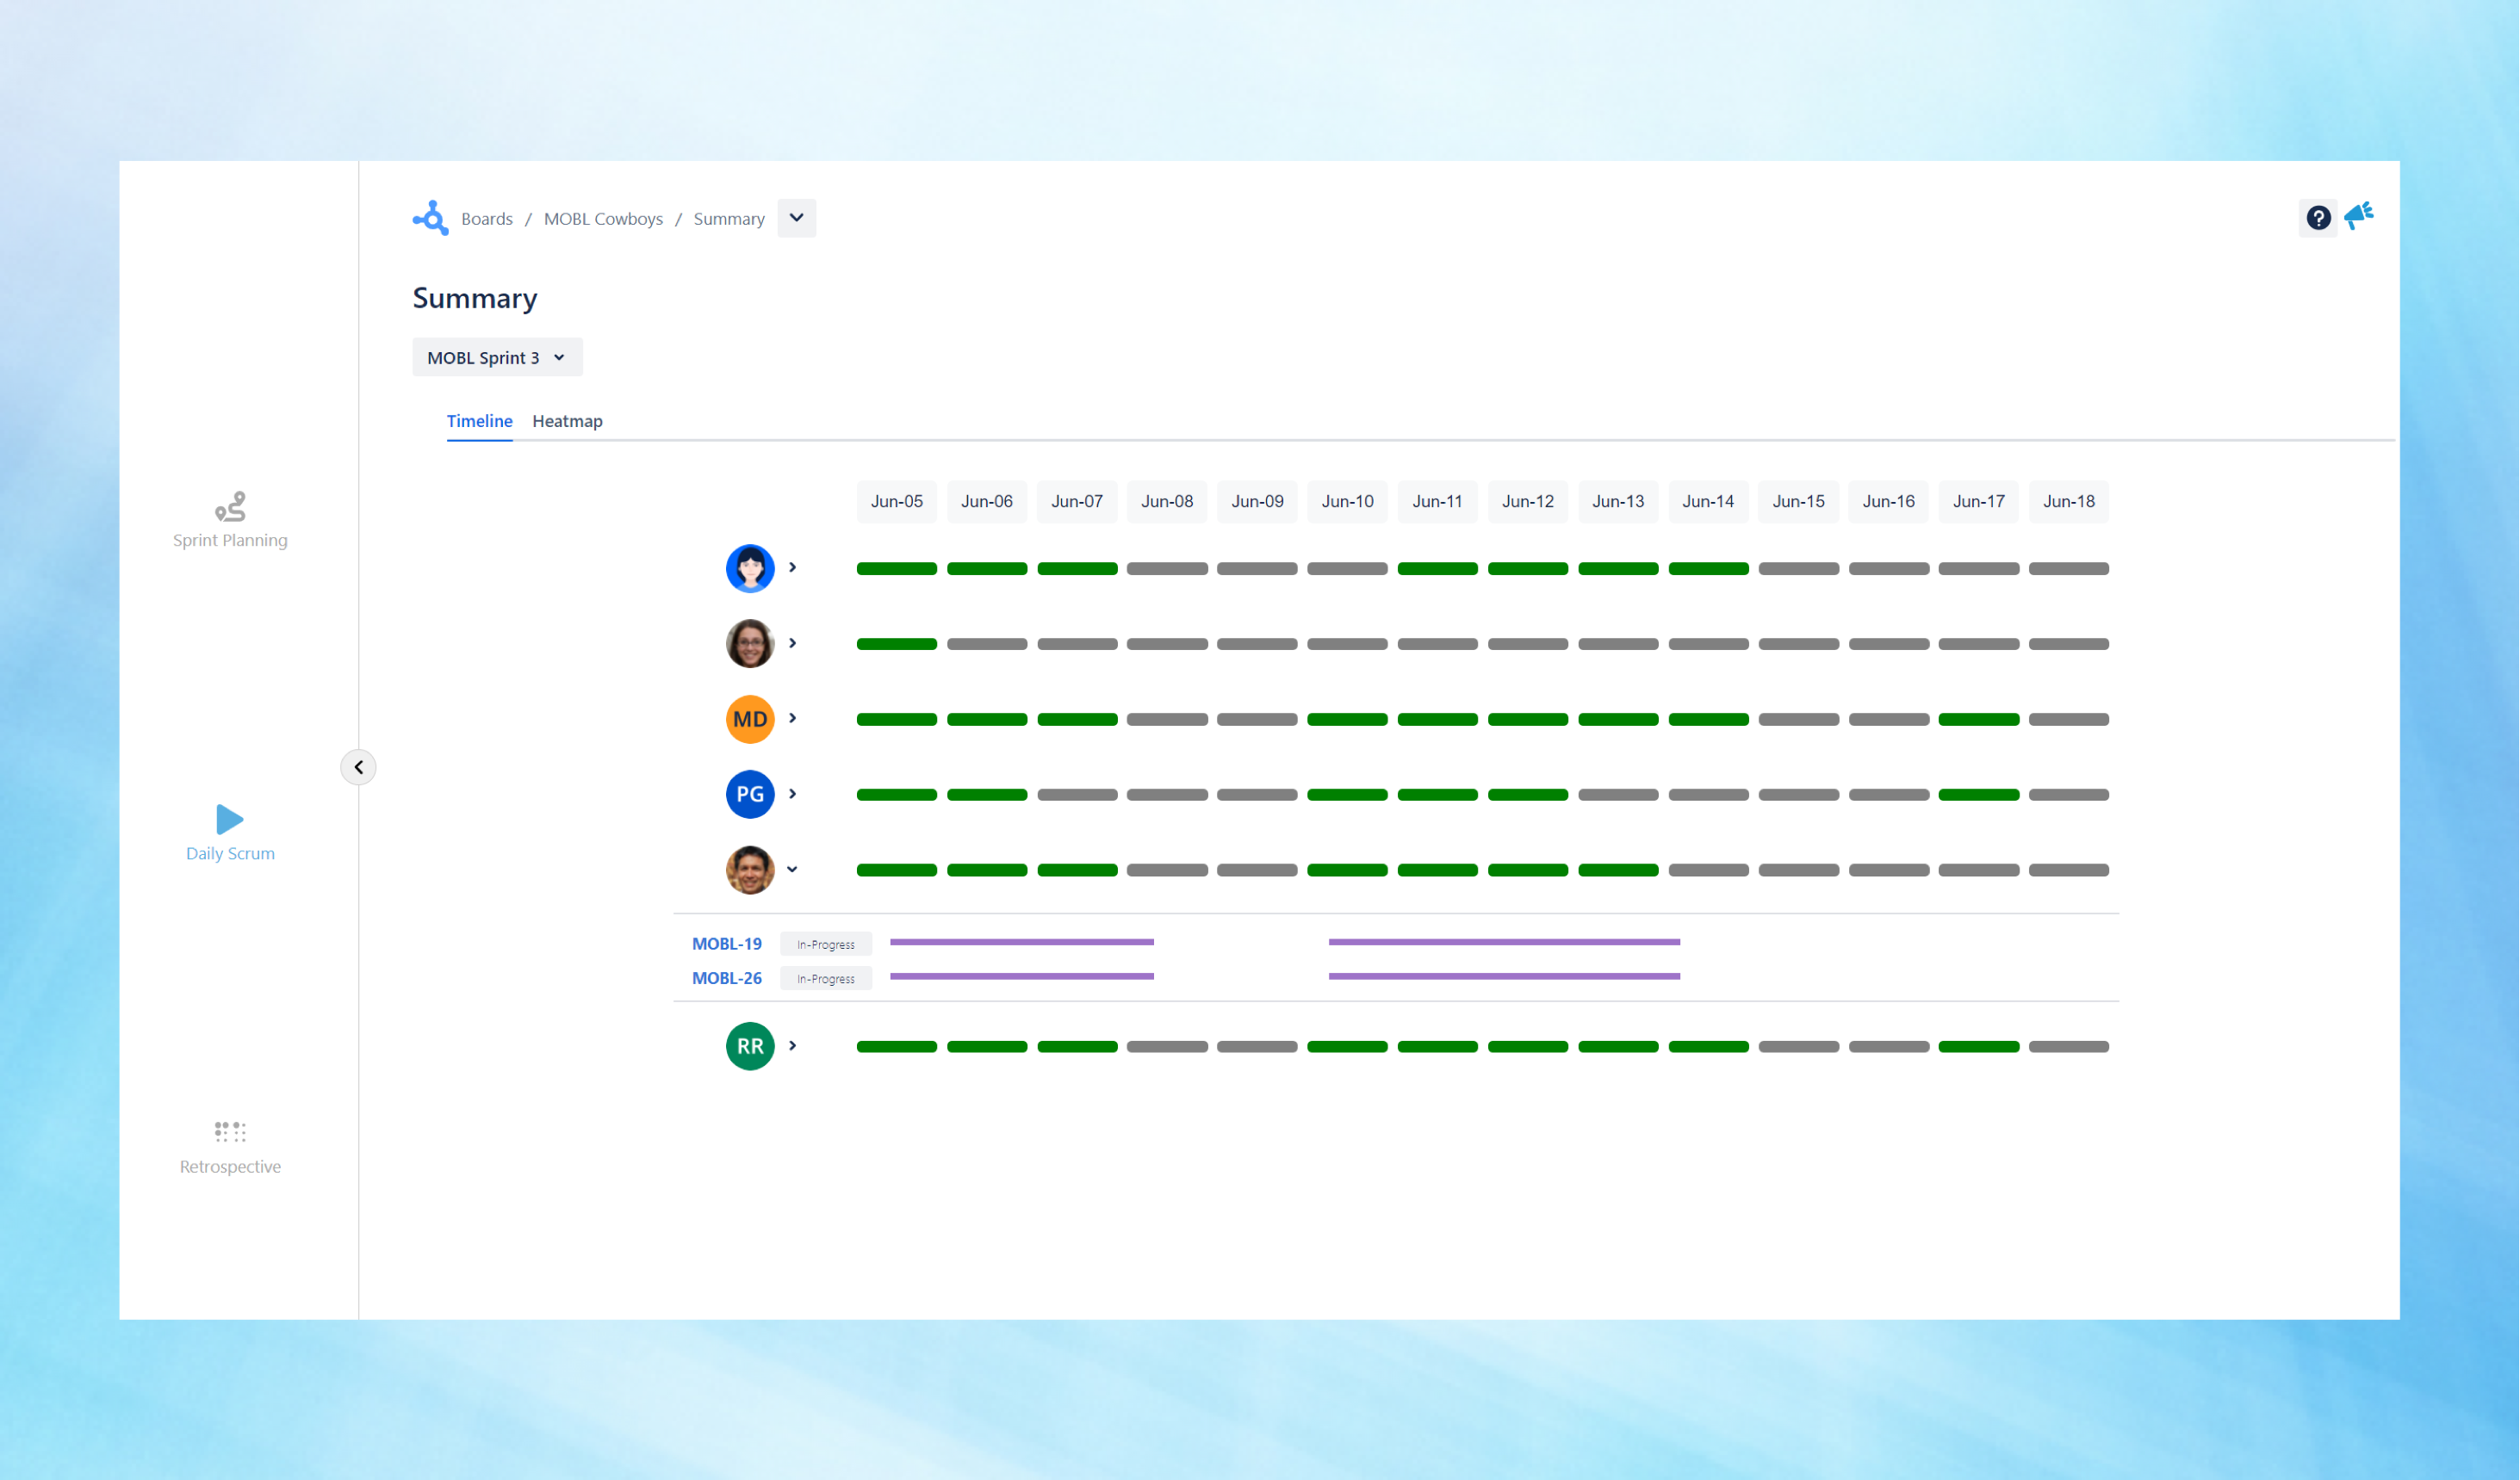
The Summary Page provides a comprehensive overview of the sprint's progress and activities. It consists of two main tabs:Timeline and Heatmap
Timeline: This new feature provides a graphical visualisation of the Jira issue activity for team members involved in the sprint.
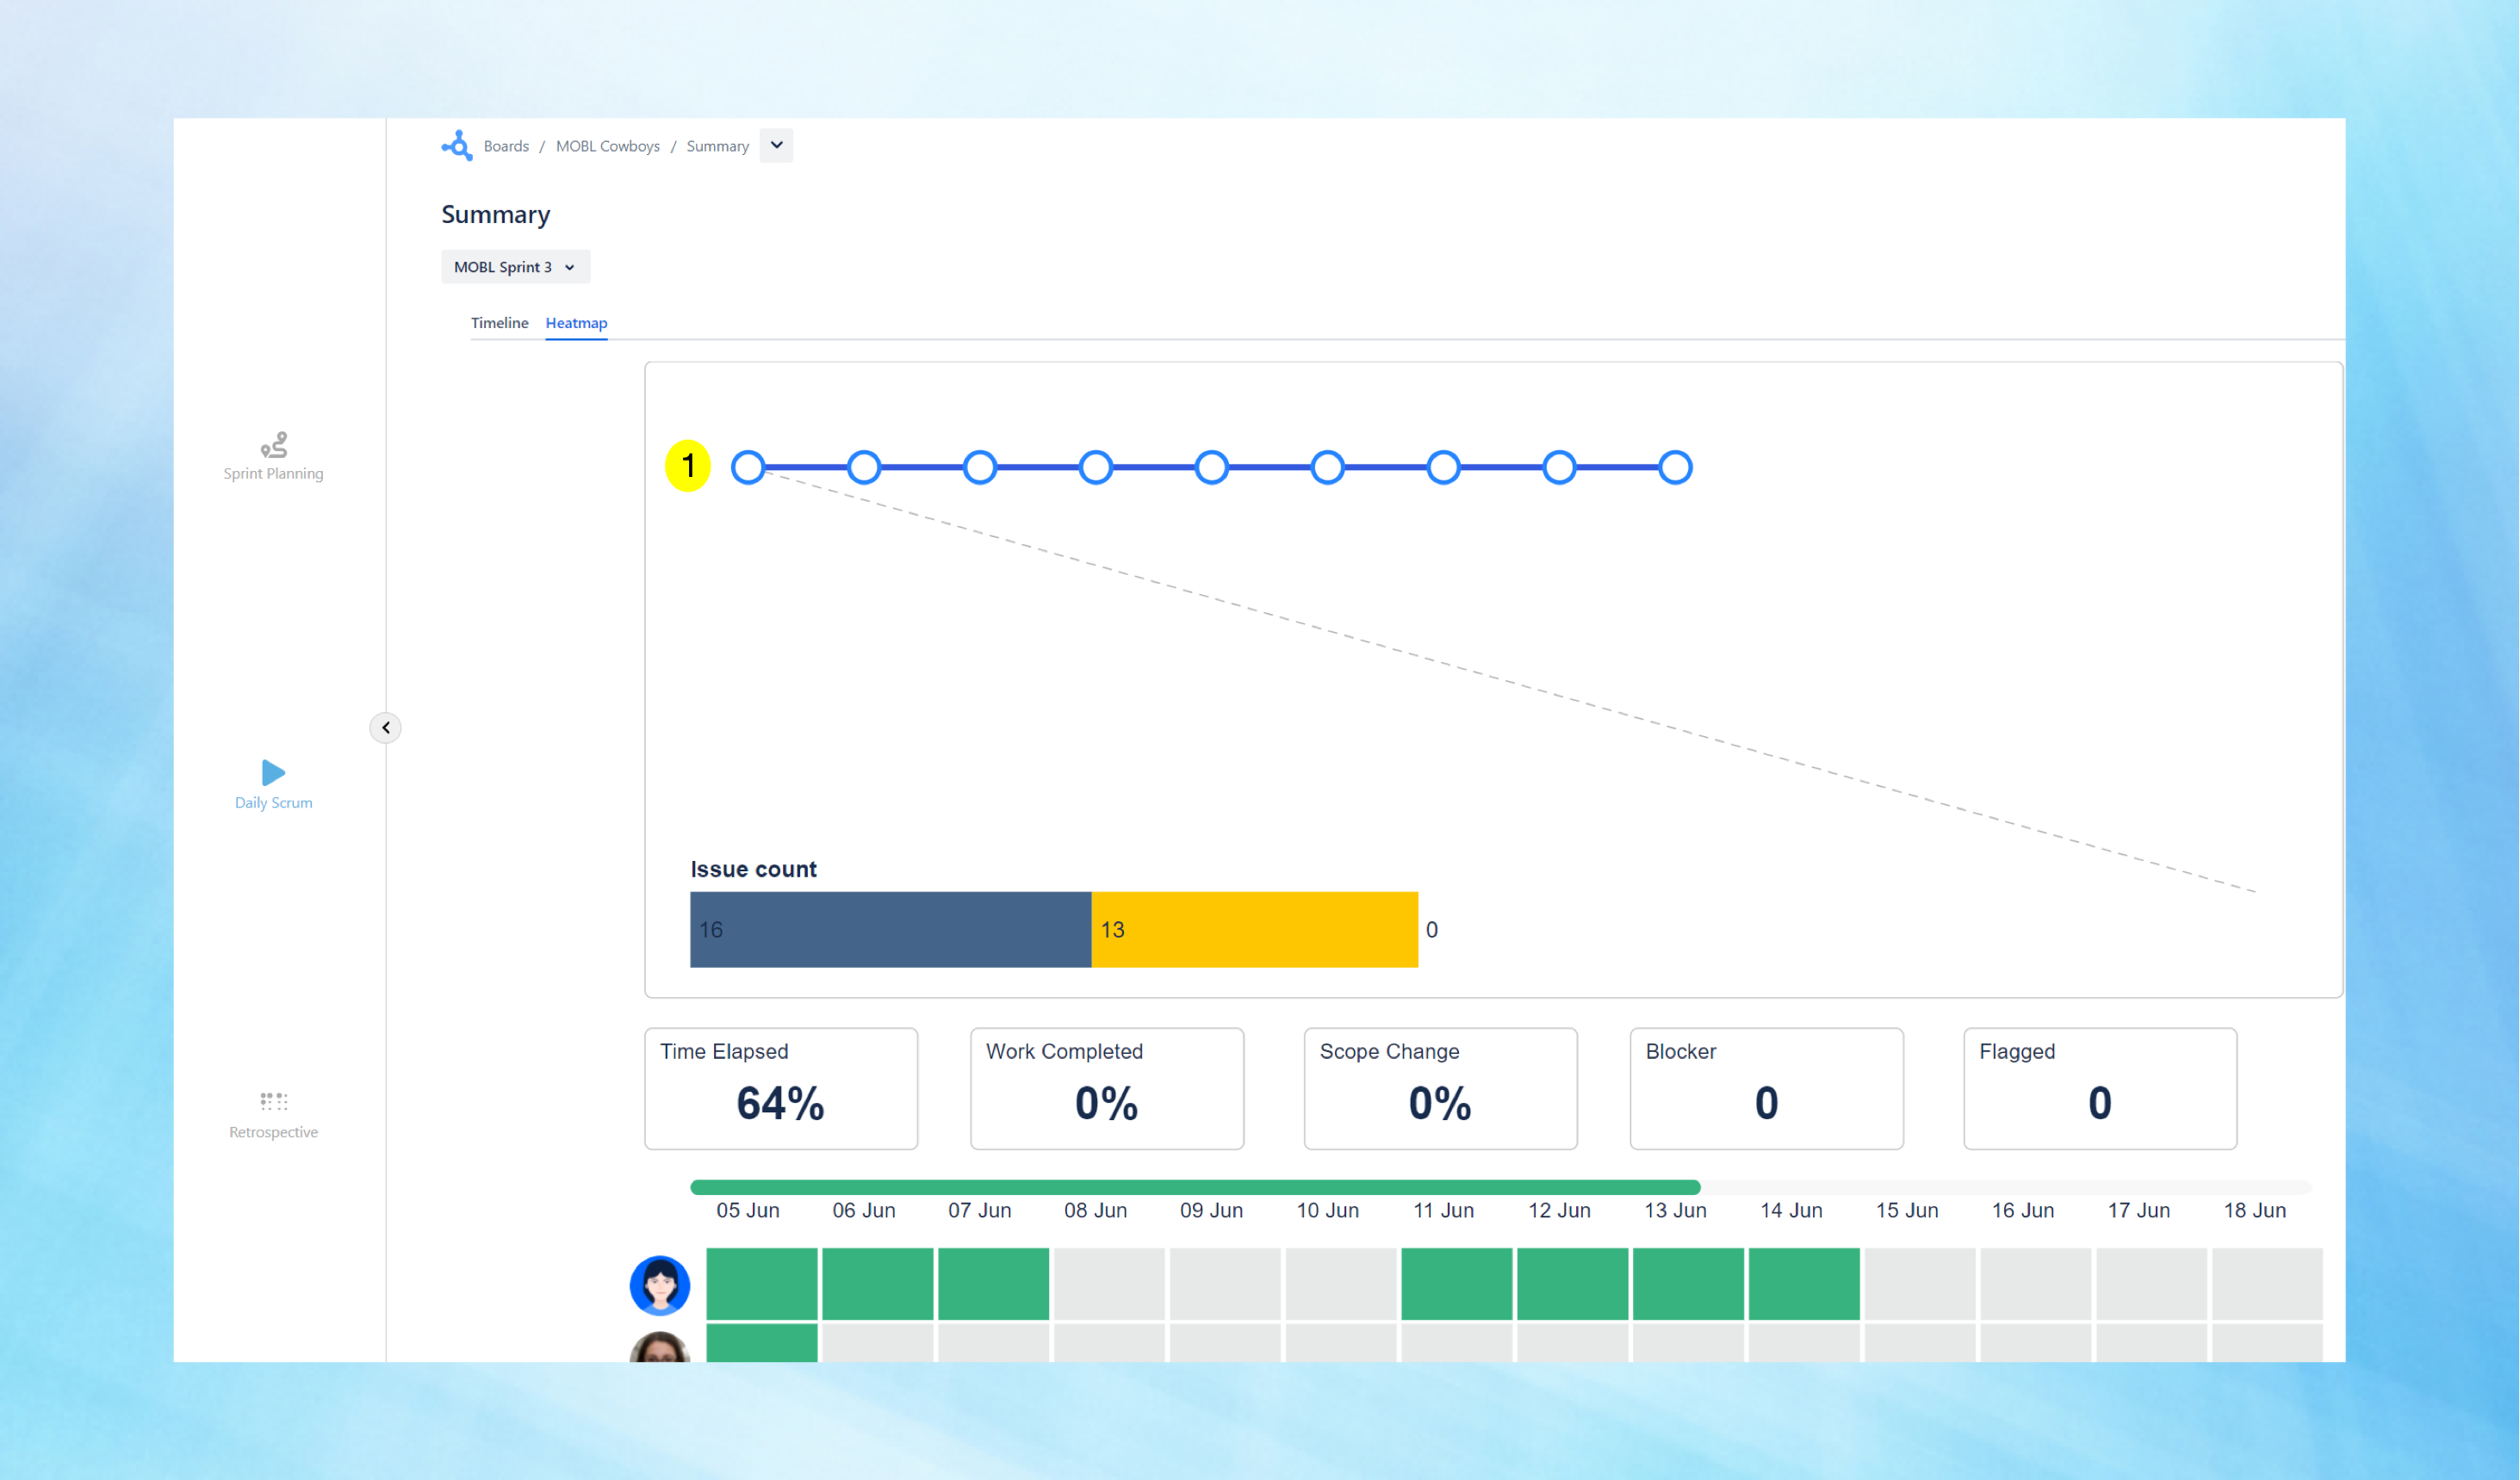
Heatmap:
-
A burndown chart is shown for a visual representation of progress
-
A detailed heatmap of the sprint is displayed.
-
Here each colored box in the table below is interactive and can be clicked to view specific sprint updates.
-
It also shows the percentage of time elapsed, work completed, scope changes, blockers, and flagged tasks.
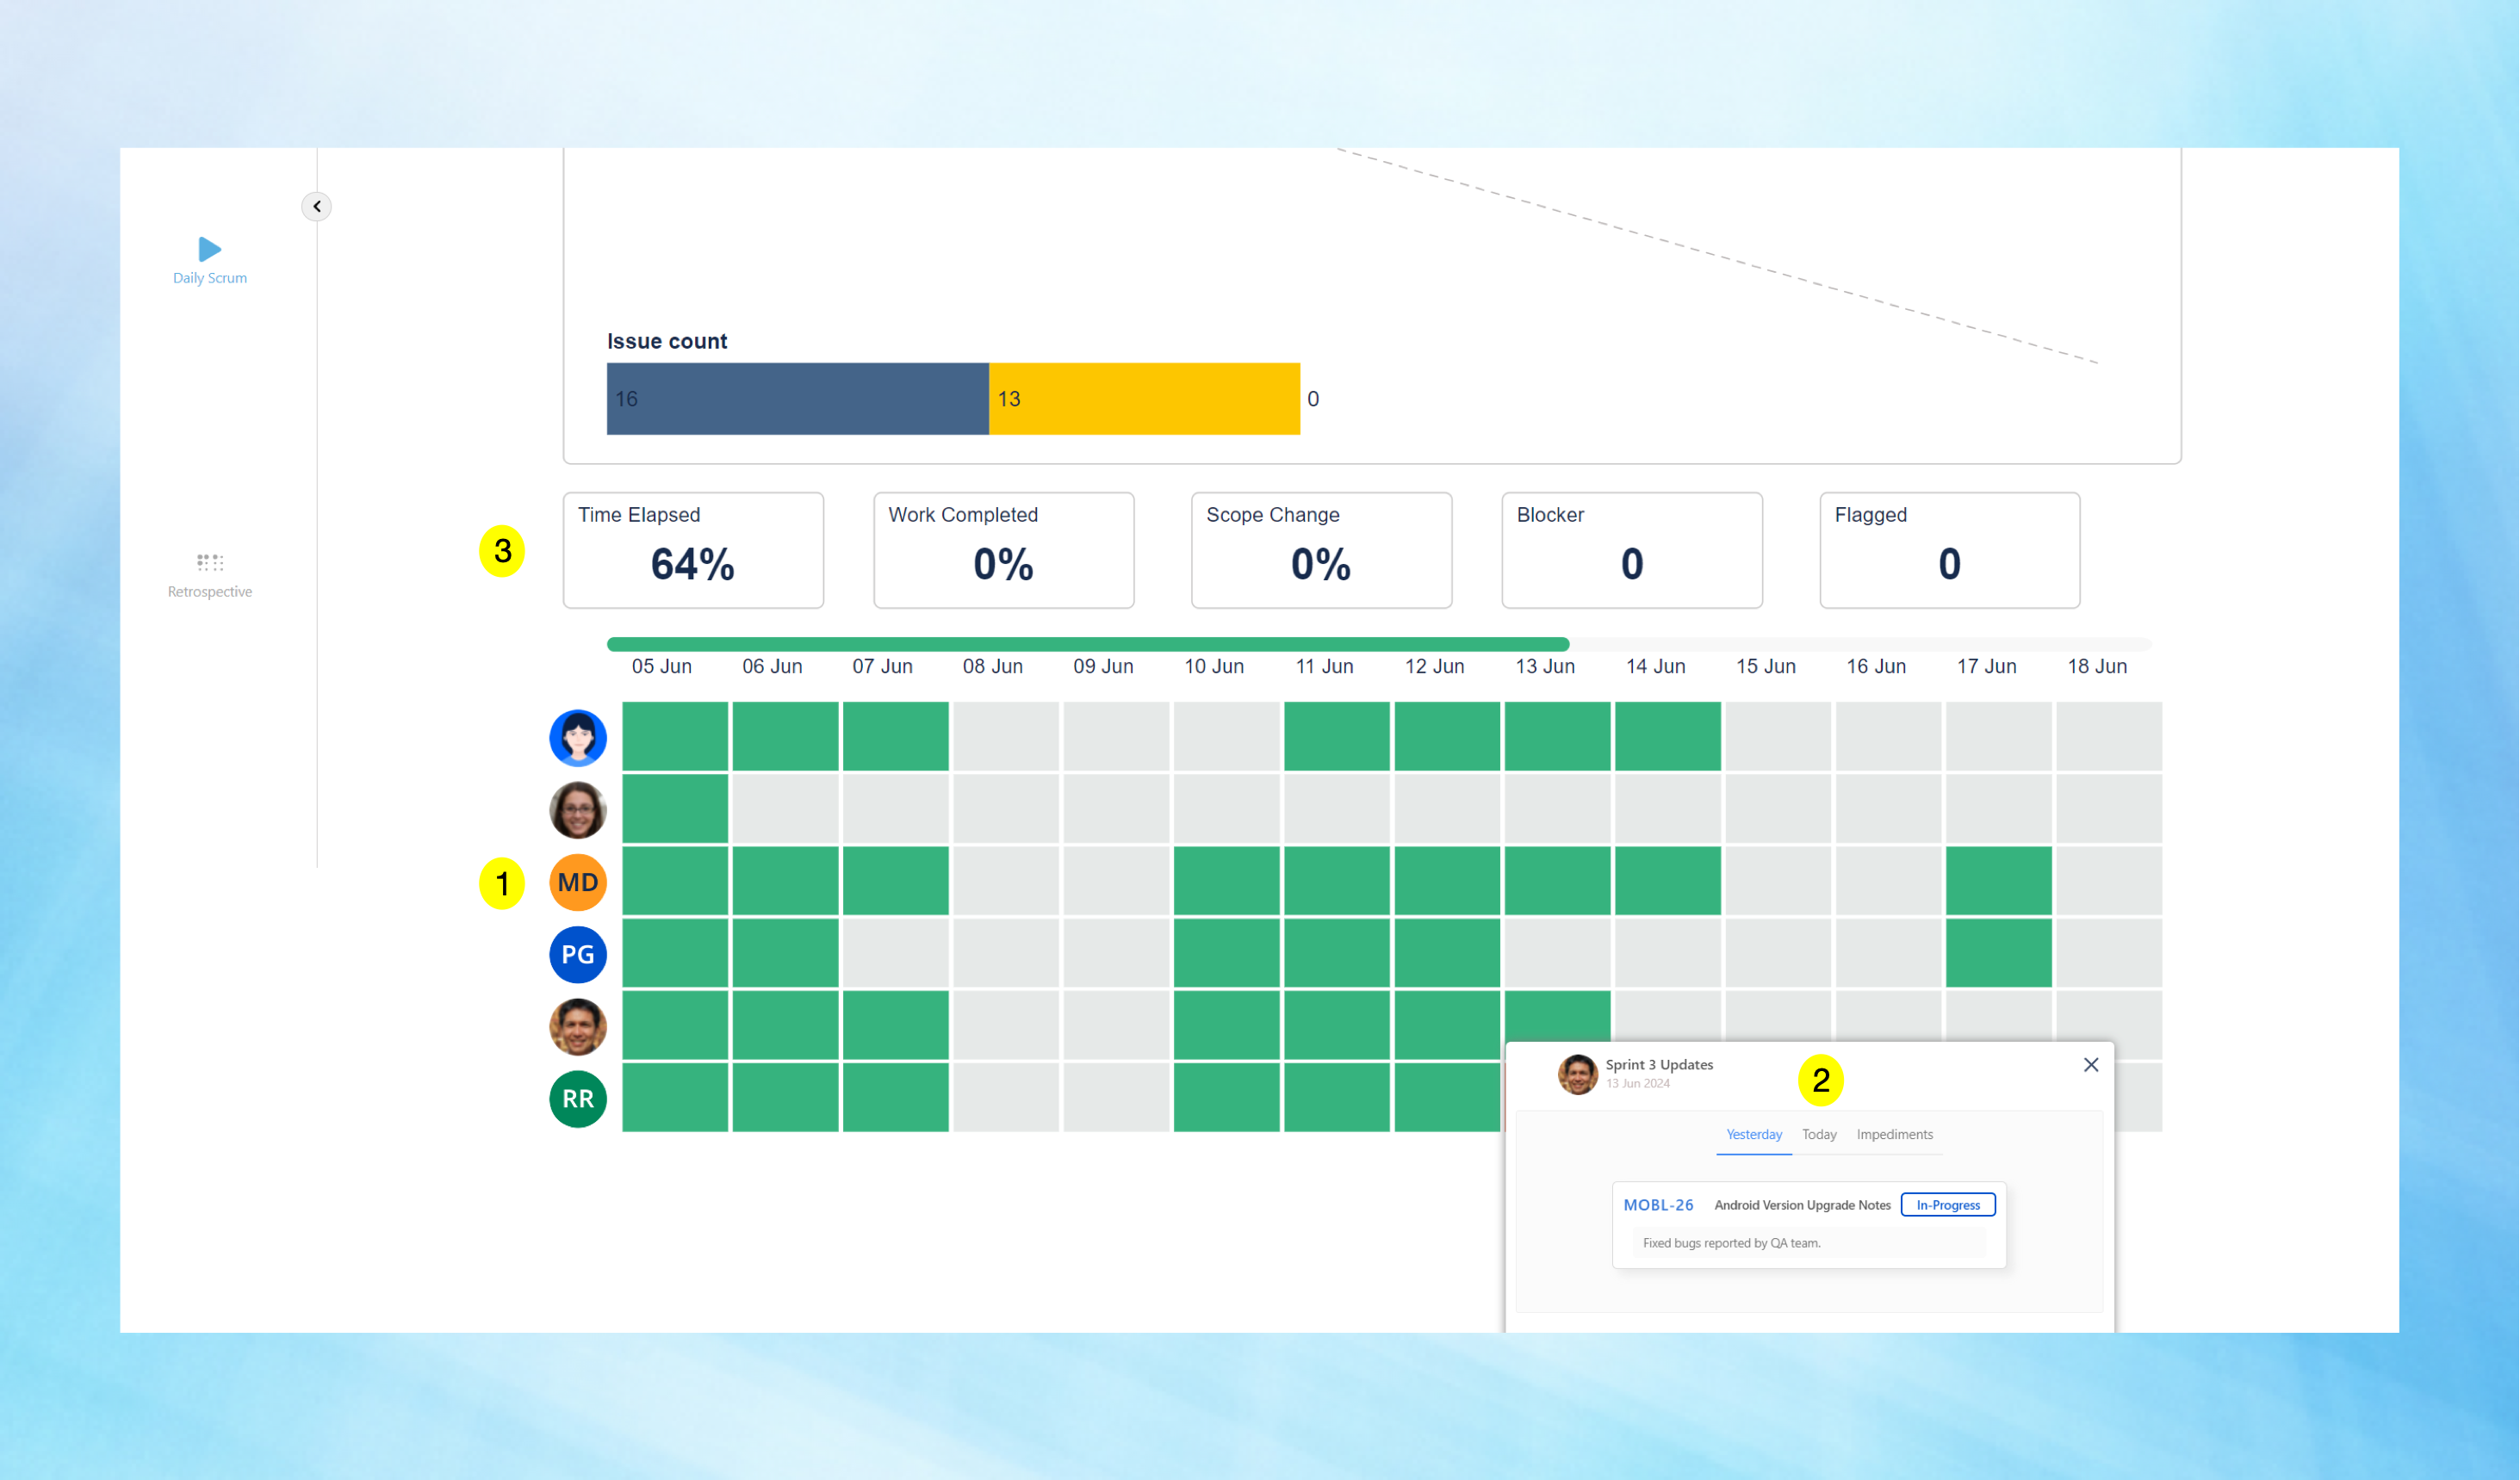
This ‘Summary’ aids in understanding the overall timeline and identifying any issues that need attention, ensuring an efficient and organized review of the sprint.