.png)
1. Getting started
Charts & Reports for Jira ServiceDesk allows you to easily Create and Share custom reports.
Thank you for choosing view26 to fast track your way to actionable insights.
Let’s get you started with using the App.
Accessing the App:
1. Install VIEW26 App
2. Log in to Jira
3. Click on Charts and Reports in the navigation-bar to enter the App

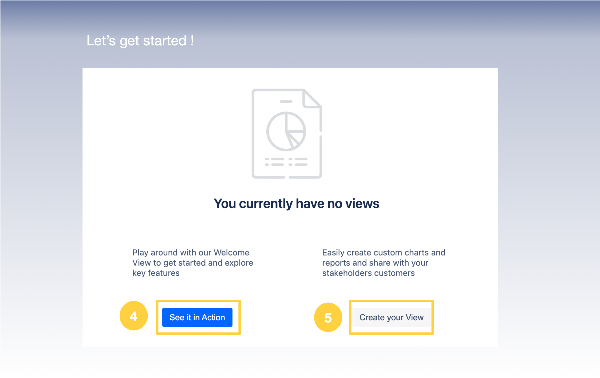
And now Let's get Started !
4. You could play around with our Welcome View to get started and explore key features by clicking See it in Action
5. Or click on Create Your View to create custom charts and reports and share with your stakeholders customers