
Review draft — 18 September 2026. Prepared from the submitted Marketplace edition definition and the test app. Marketplace approval is pending. Keep this page unpublished until the content and release availability have been reviewed.
Choose your edition
Charts and Reports for JSM offers Standard and Advanced editions. Advanced includes the Standard reporting features and adds Backlog Trend, Time in Status, and Issue Aging.
|
Capability |
Standard |
Advanced |
|---|---|---|
|
Custom charts and dashboards; SLA and CSAT reporting; basic and JQL filtering; interactive drilldowns |
Included |
Included |
|
Customer portal reports; dashboard sharing and permissions; PDF, Excel and image exports; scheduled email reports; custom branding |
Included |
Included |
|
Backlog Trend, Time in Status, Issue Aging |
Requires Advanced |
Included |
Add an Advanced widget
-
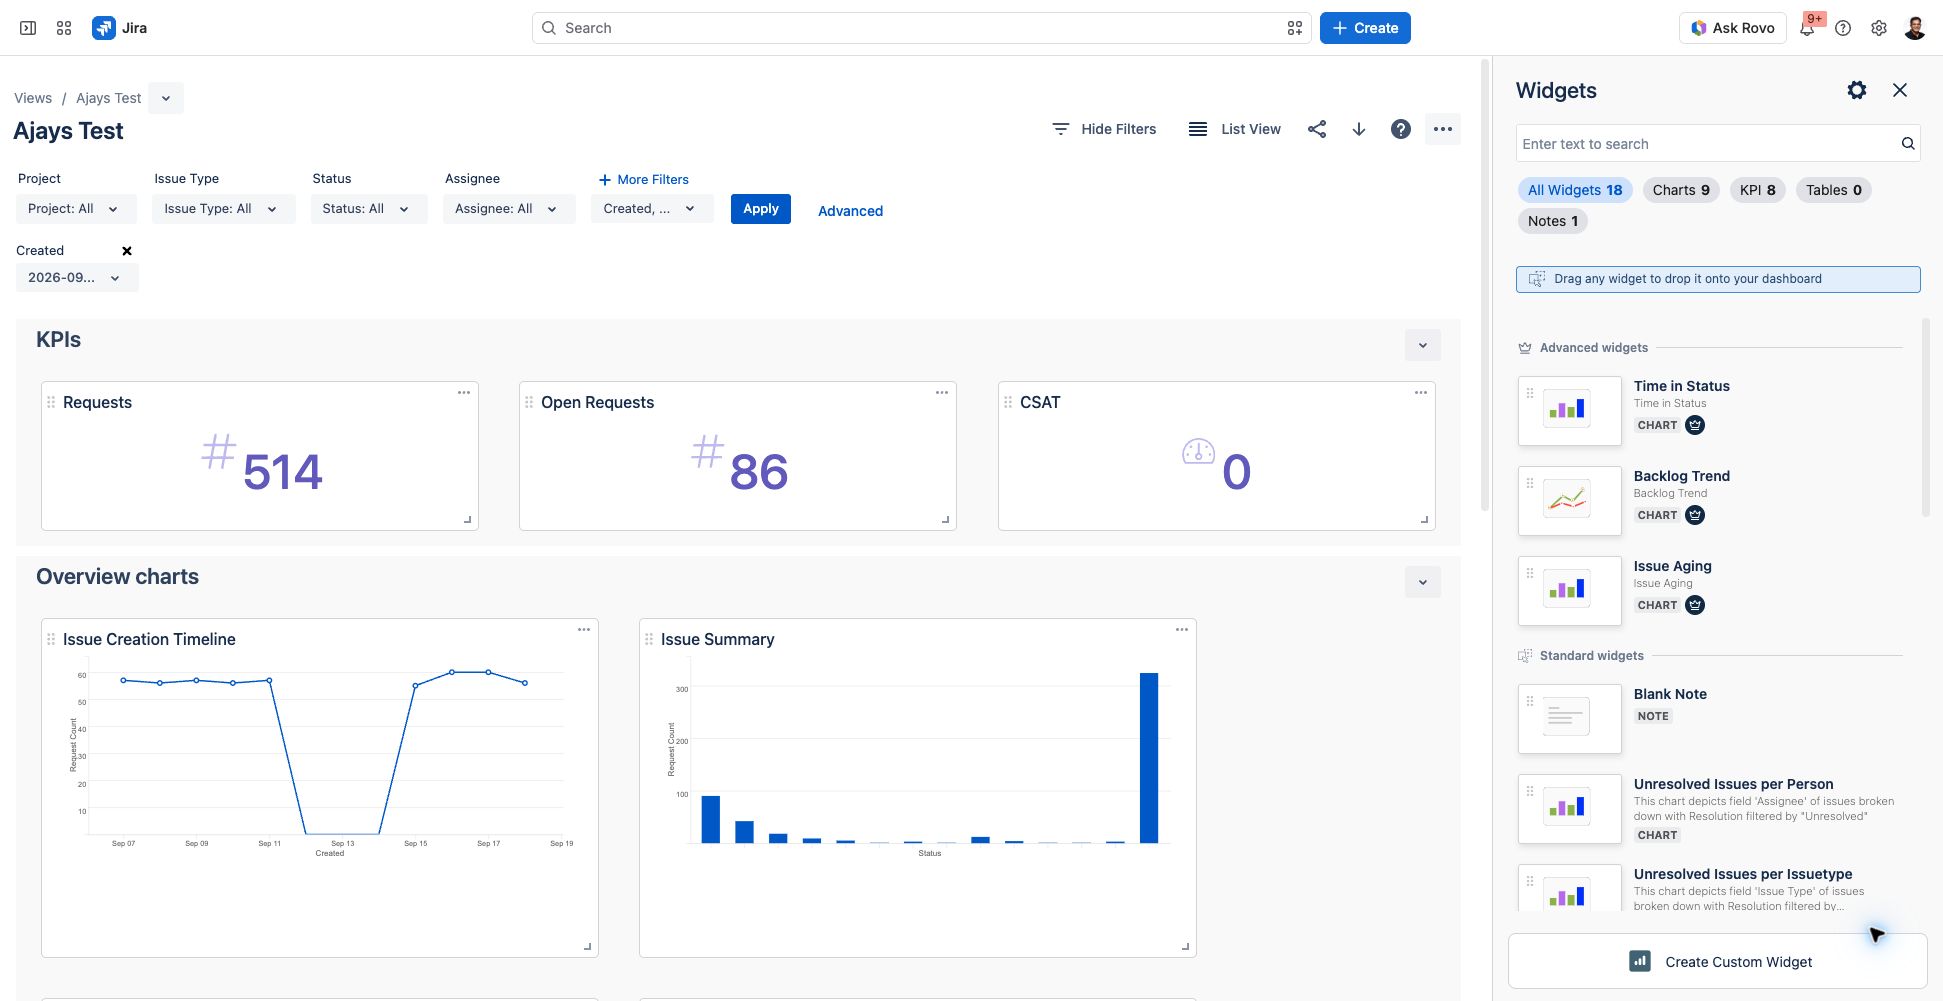
Open a view you can edit and select the blue + button at the bottom right.
-
In Widgets, find Advanced widgets. The Advanced badge identifies Time in Status, Backlog Trend, and Issue Aging.
-
Drag a widget onto your dashboard, or choose Create Custom Widget to configure one.
-
For a custom widget, enter a name and optional description, select Chart, and choose Next.
-
In Filters, select Built-in Chart, then choose the Advanced chart from Built-in Charts.
-
Configure the chart, choose Next to preview it, then select Create when ready.
Screenshot 1. The widget library separates Advanced widgets from Standard widgets.
Backlog Trend
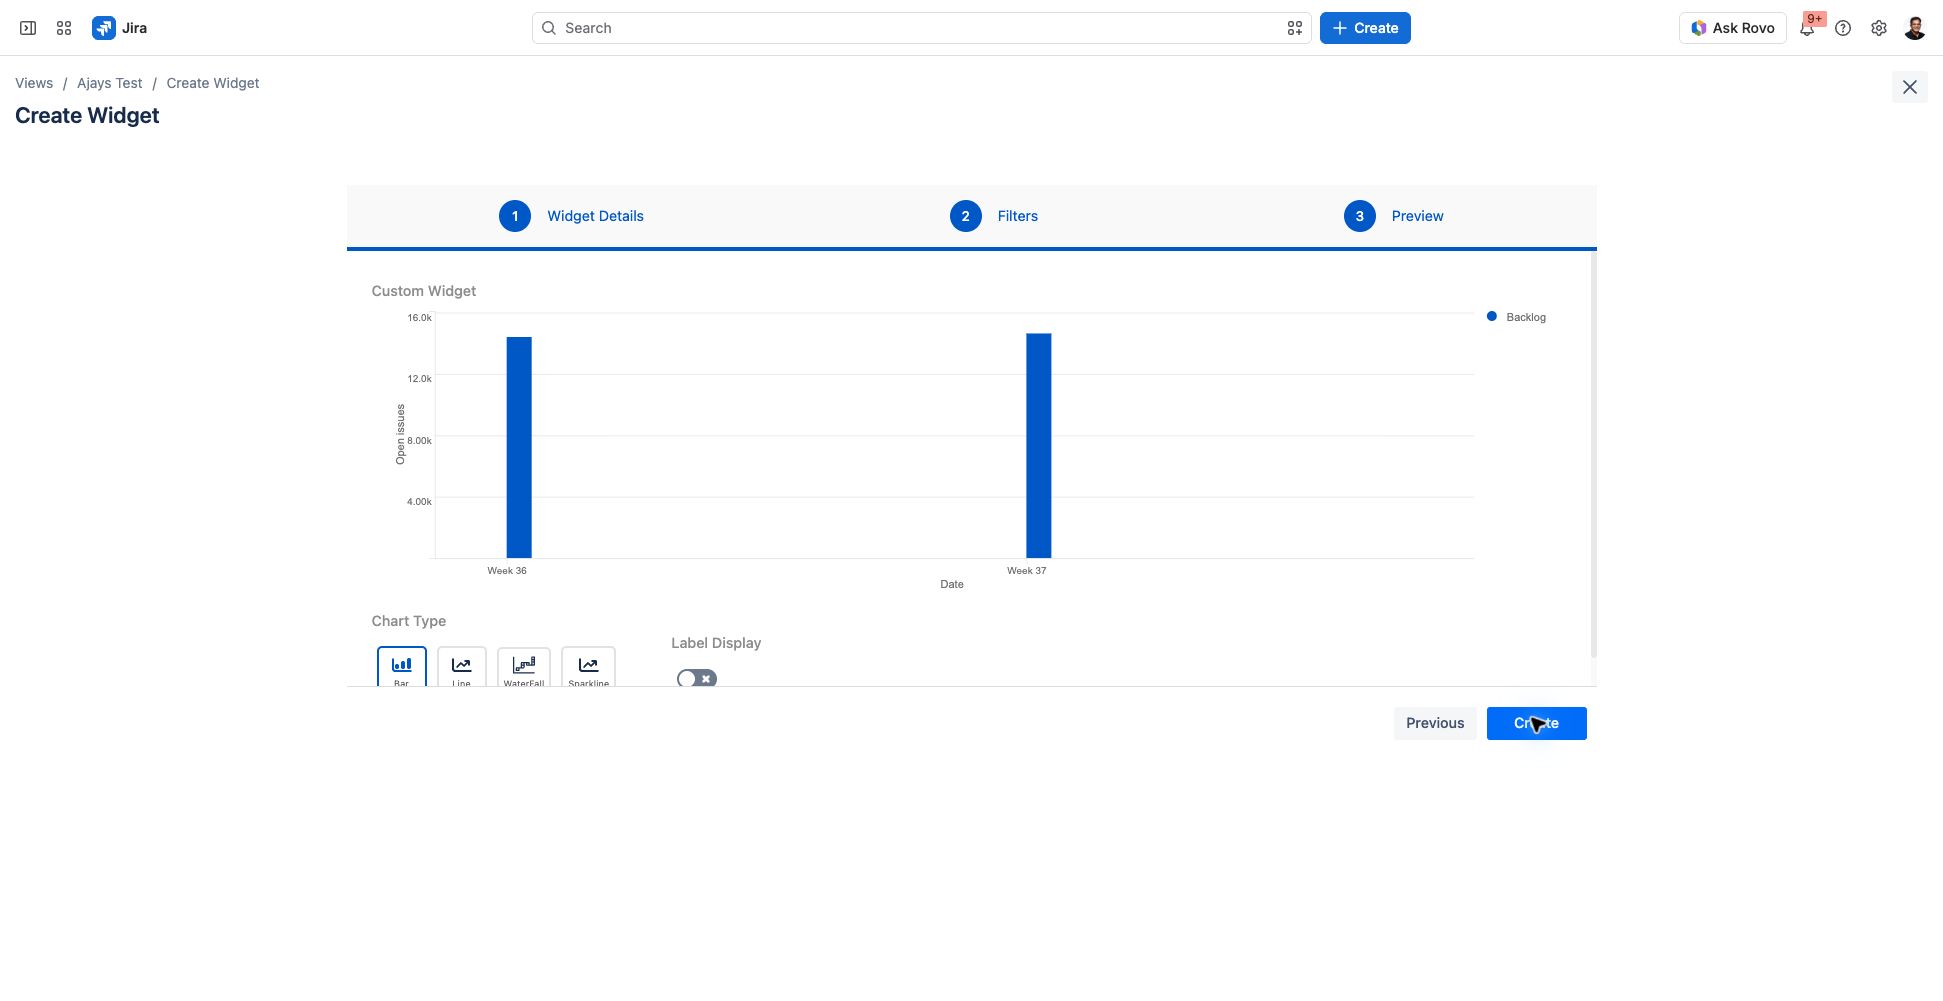
Use Backlog Trend to see how the historical open-issue backlog changes over time and identify growing queues. It answers “How much work was open at each point in time?”
-
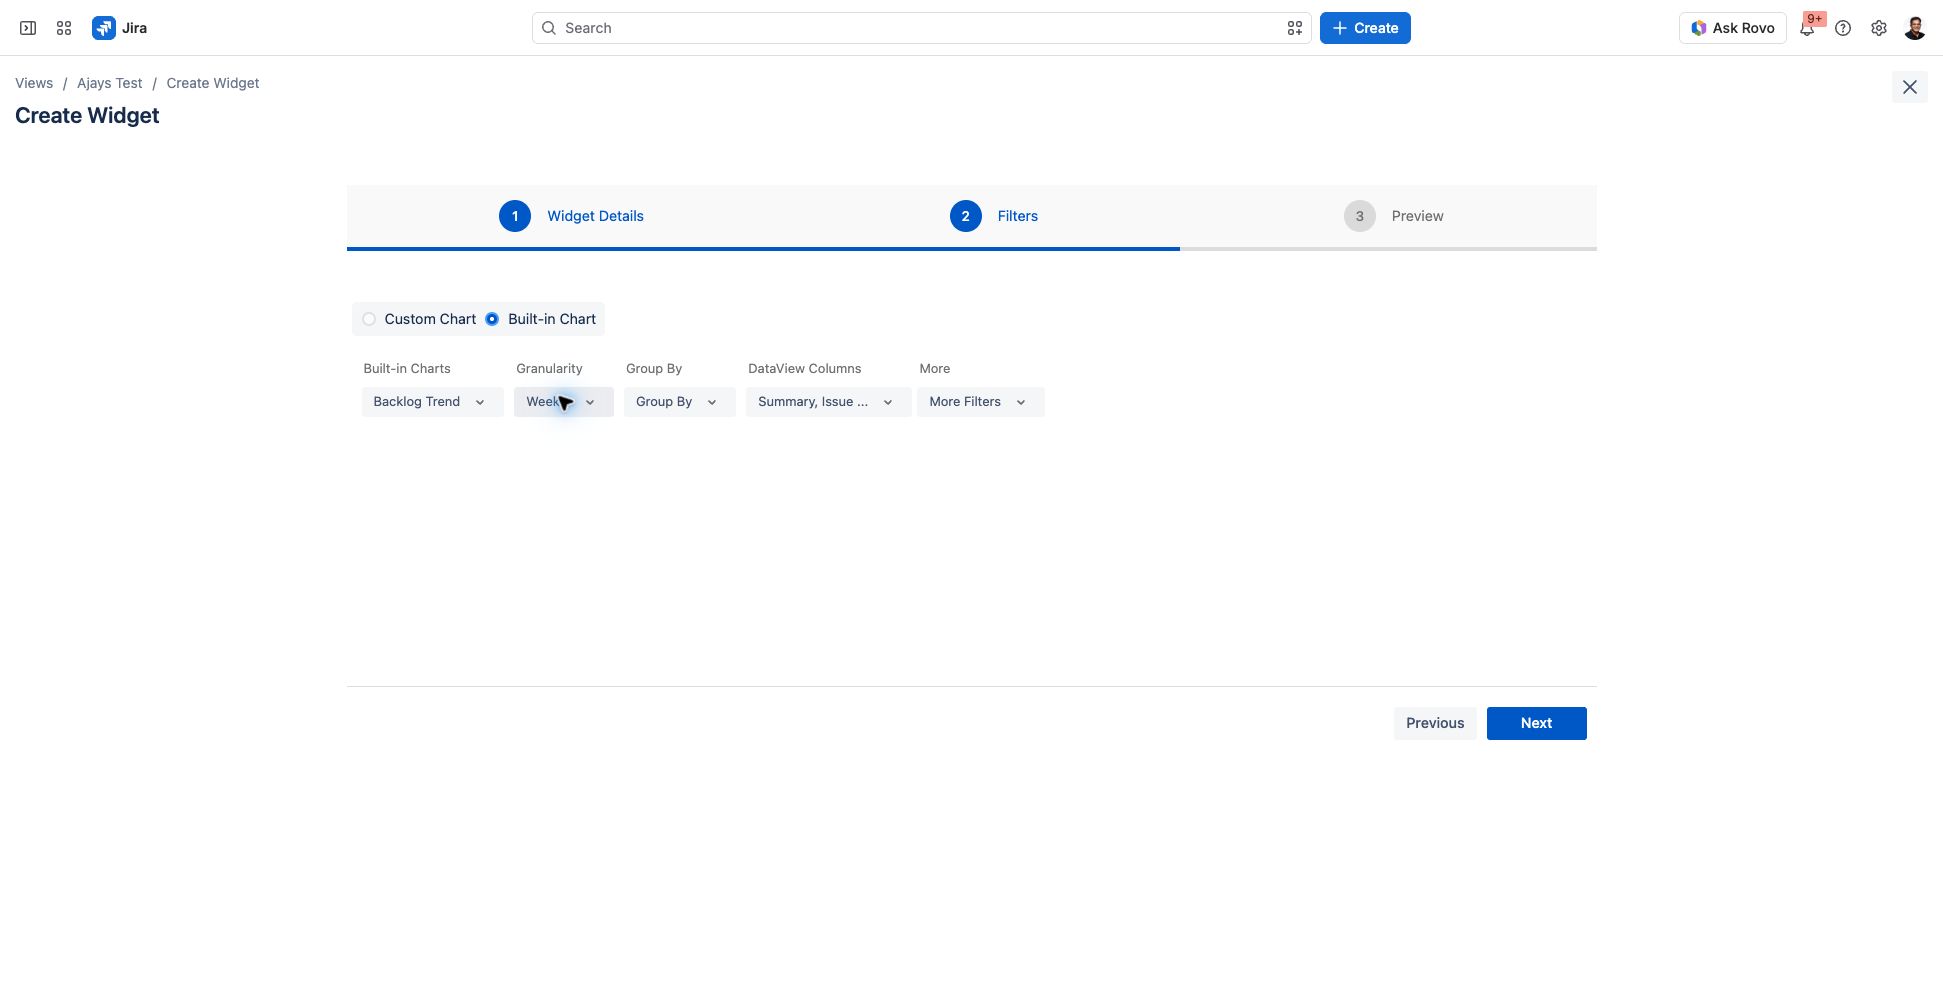
Select Backlog Trend under Built-in Charts.
-
Set Granularity to Daily, Weekly, or Monthly.
-
Optionally choose Group By to compare the available categories, and adjust More Filters to focus the report.
-
Choose Next, review the preview and available chart styles, then create the widget.
A historical backlog is different from a count of issues created in each period. When comparing charts, use a consistent reporting scope and check the view’s filters.
Screenshot 2. Backlog Trend configured with weekly granularity.
Time in Status
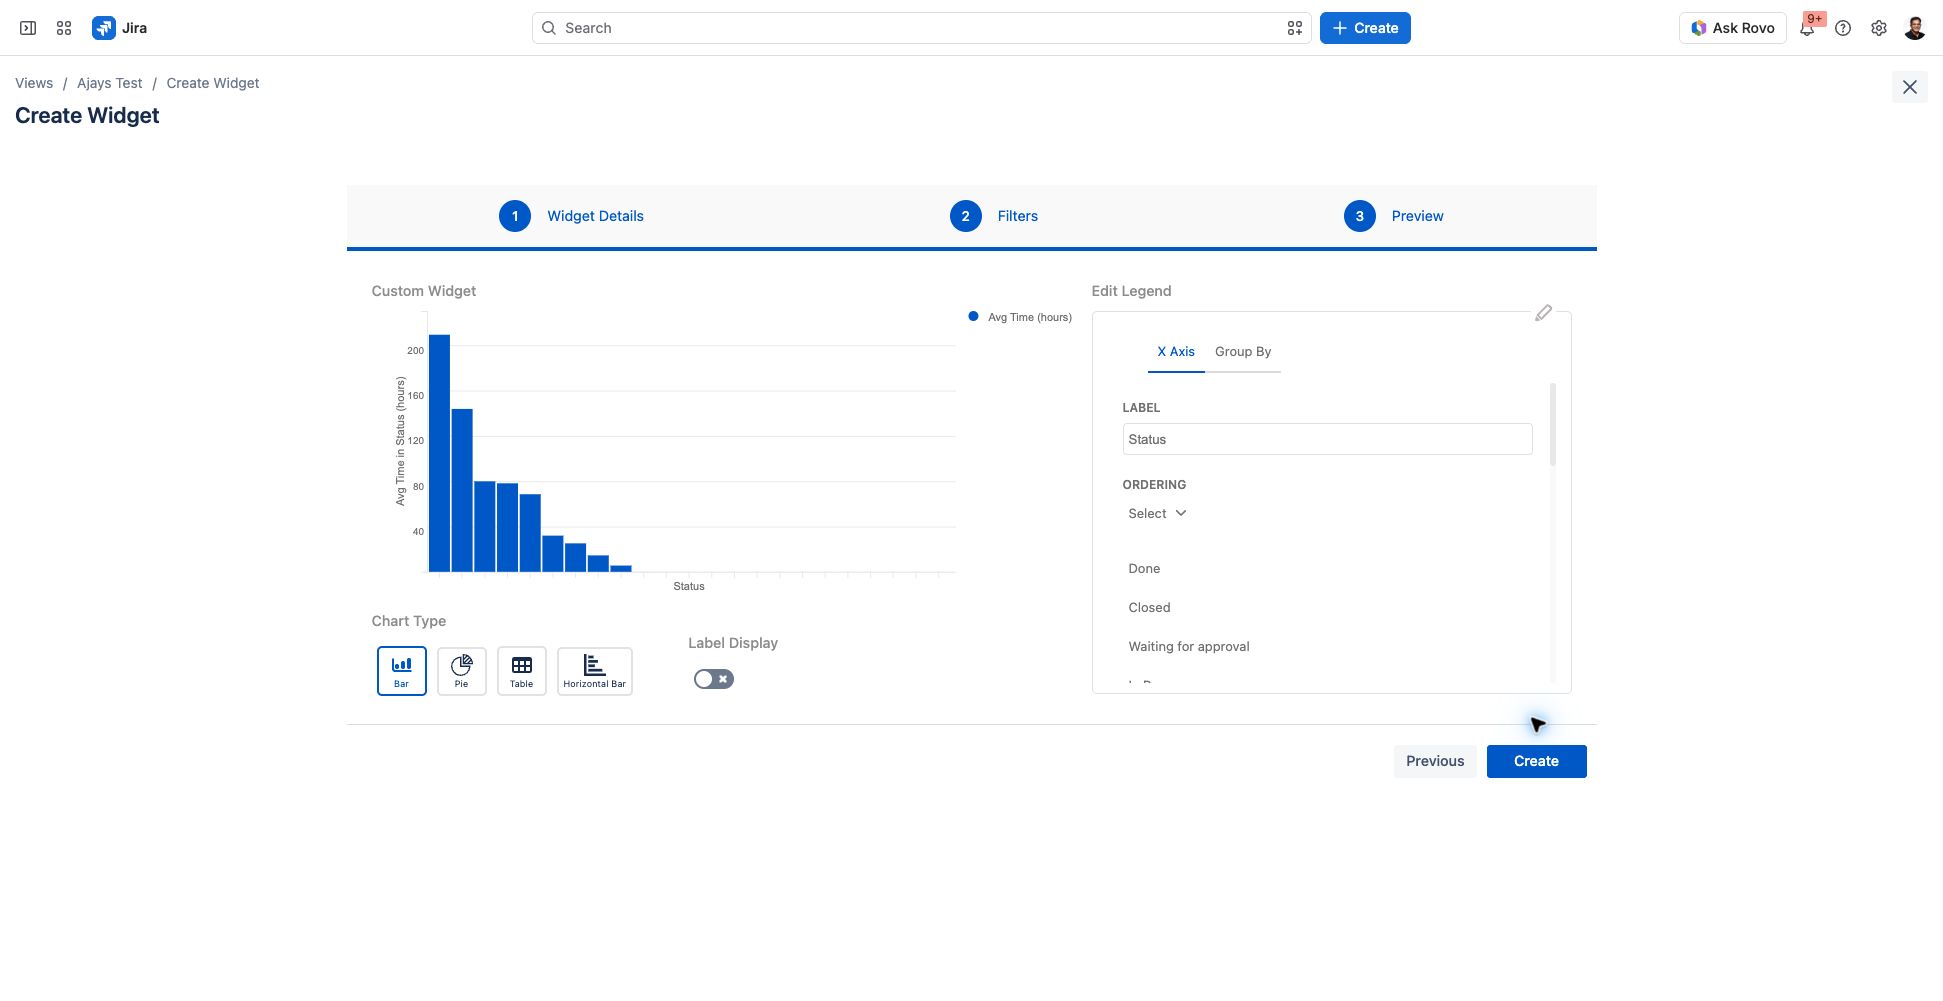
Use Time in Status to understand how long issues spend in workflow statuses and identify bottlenecks. The feature includes repeated visits to a status.
-
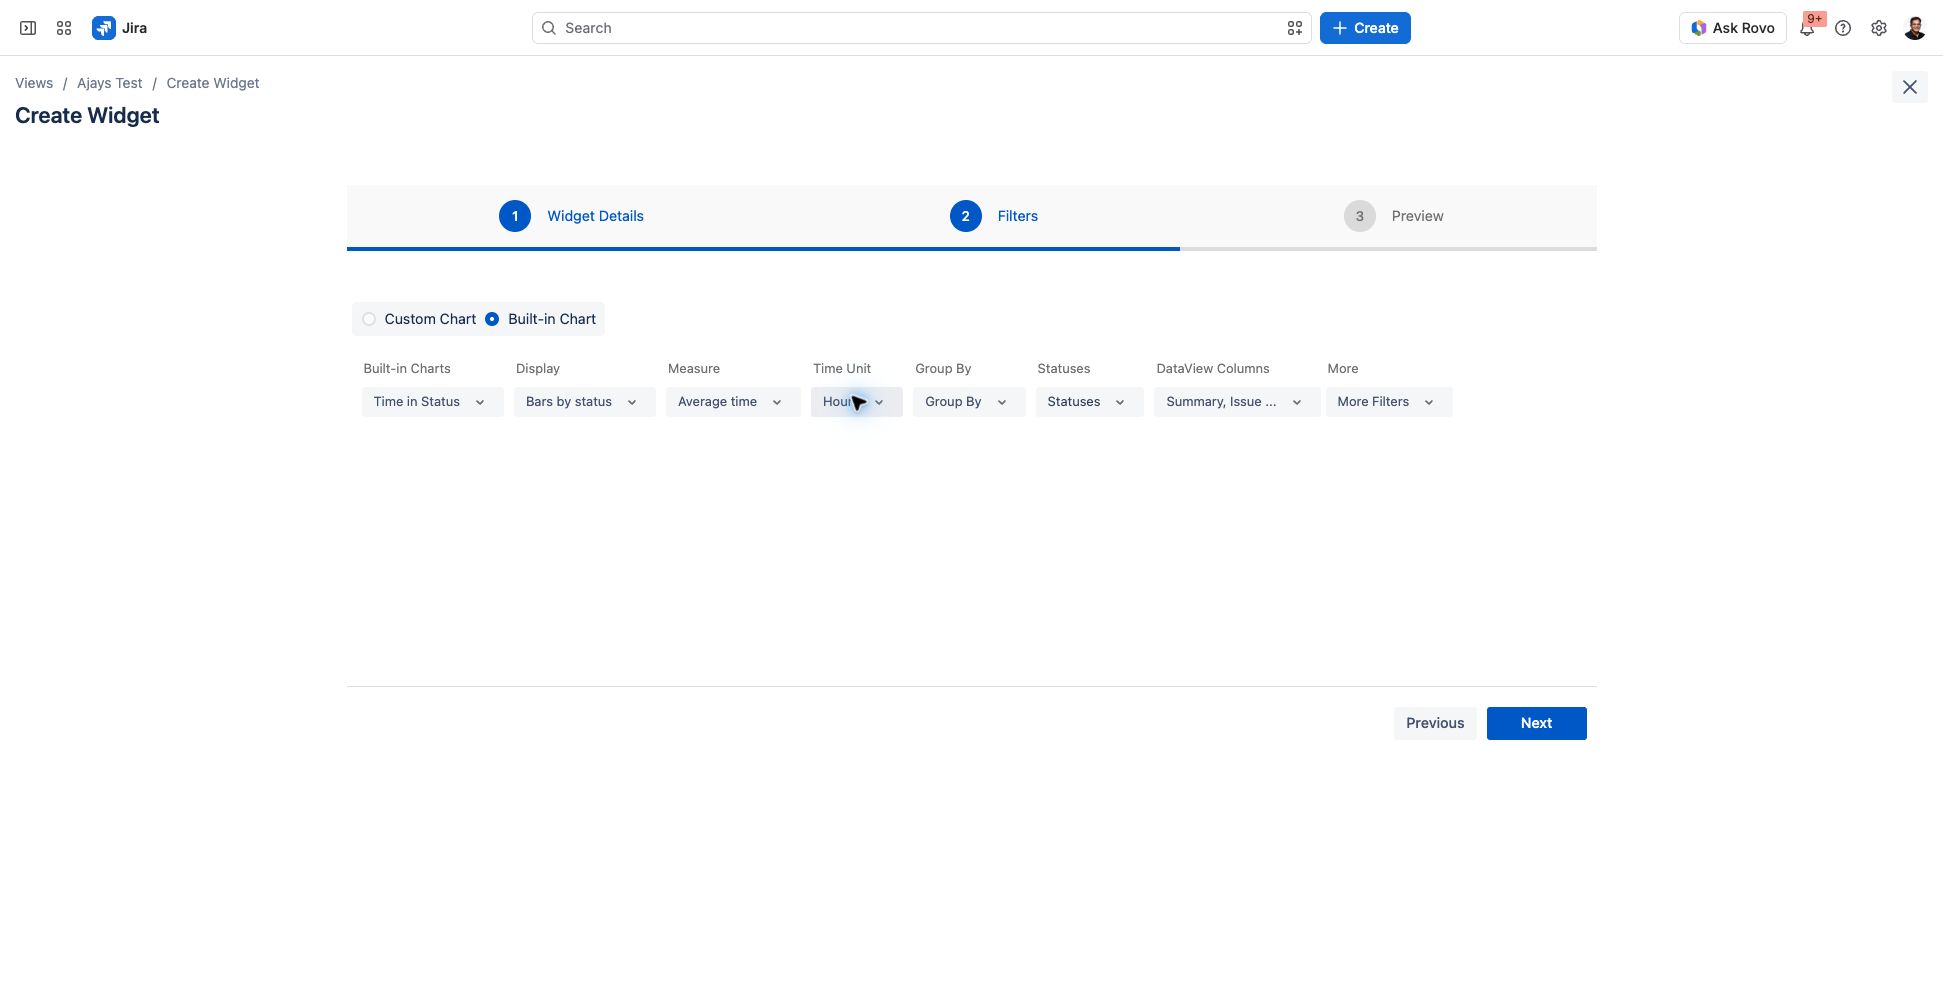
Select Time in Status under Built-in Charts.
-
Set Display to Bars by status and Measure to Average time.
-
Choose Days or Hours as the Time Unit.
-
Use Statuses to focus on particular workflow stages and optionally select Group By.
-
Choose Next, review the preview, and create the widget.
For example, compare time in “Waiting for approval” and “In Progress” to decide where to investigate delays. This is a workflow-duration report; use the SLA reports when you need SLA results.
Screenshot 3. Time in Status configured for average time in hours.
Issue Aging
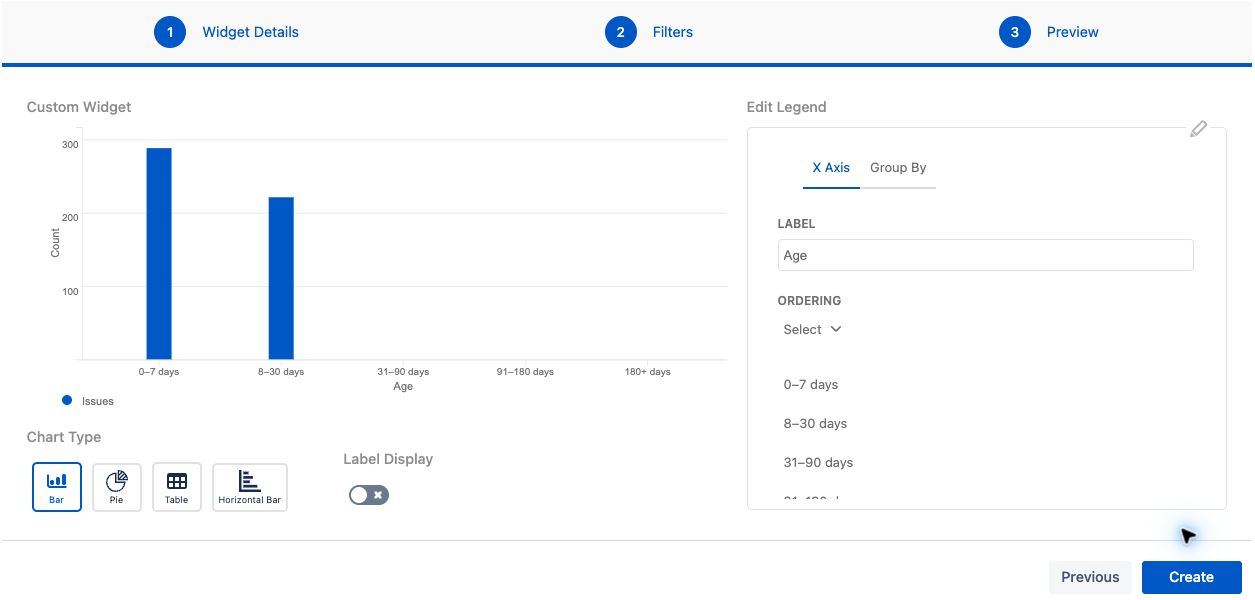
Use Issue Aging to group open or resolved issues into age ranges, spot older work, and prioritize follow-up.
-
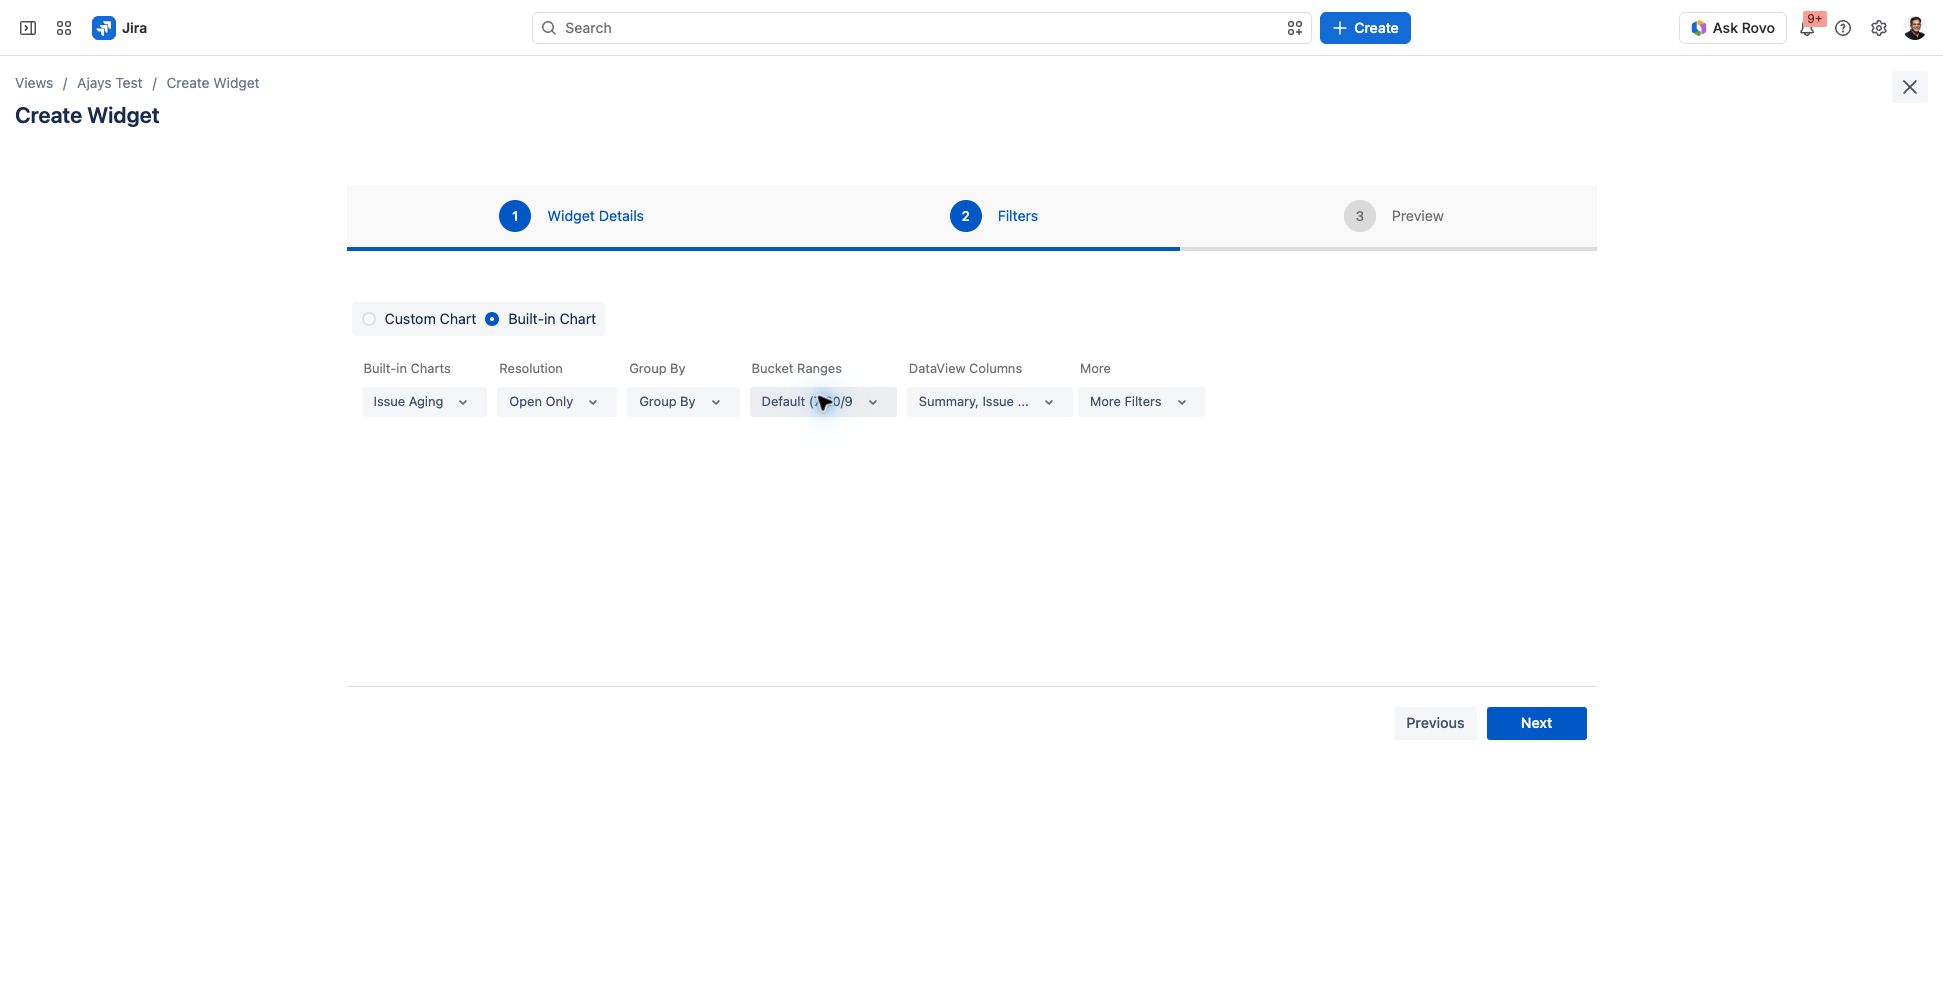
Select Issue Aging under Built-in Charts.
-
Set Resolution to All Issues, Open Only, or Resolved Only.
-
Optionally choose Group By to compare categories.
-
Select a Bucket Ranges preset: Default (7/30/90/180), Weekly (7/14/21/28), or Quarterly (30/90/180/365).
-
Choose Next, inspect the distribution, and create the widget.
Start with Open Only for a follow-up queue. Use the weekly preset for short review cycles or the quarterly preset for longer-running work. The preview displays age buckets in days.
Screenshot 4. Issue Aging configured for open issues and the default bucket ranges.
Example previews
These screenshots show previews from the test site. Values depend on the data and filters in your view.
Backlog Trend — weekly
Time in Status — average hours
Issue Aging — open issues
Related help